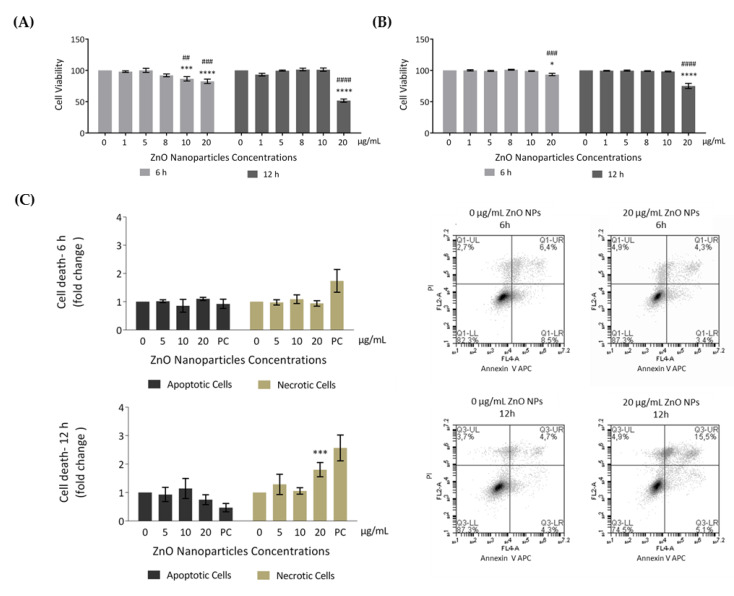
Figure 3.
Evaluation of cell viability induced by ZnO NPs in GC-1 spg cells: (A) Cell viability was assessed using the resazurin assay. Results from the viability analysis of GC-1 cells after exposure for 6 h and 12 h to different ZnO NP concentrations: The viability for each condition is presented as mean ± SEM of seven independent experiments. Values are expressed as arbitrary units, and the cell viability of the control condition was given a value of 100. (B) Cell viability was assessed using the trypan blue exclusion method. Trypan blue analysis of GC-1 cells after exposure for 6 h and 12 h to different ZnO NPs concentrations: The viability for each condition is presented as mean ± SEM of six independent experiments. Values are expressed as arbitrary units, and the cell viability of the control condition was given a value of 100. (C) Cell viability was assessed by flow cytometry analysis of Annexin V/ propidium iodide (PI). Flow cytometry analysis of Annexin V-APC and PI staining and of membrane and DNA markers, respectively, in the GC-1 cell line after exposure to 0, 5, 10, and 20 µg/mL of ZnO NPs for 6 h and 12 h. Positive control was performed using H2O2. The fold change in controls (cells without ZnO NPs) of apoptotic and necrotic cells was plotted as mean ± SEM of four independent experiments, for each condition. * For comparisons between concentrations and time points, two-way ANOVA was used. # For comparisons between concentrations, one-way ANOVA was used. */# p < 0.05. **/## p < 0.01. ***/### p ≤ 0.001. ****/#### p < 0.0001. PI—Propidium Iodide. PC—Positive Control.

