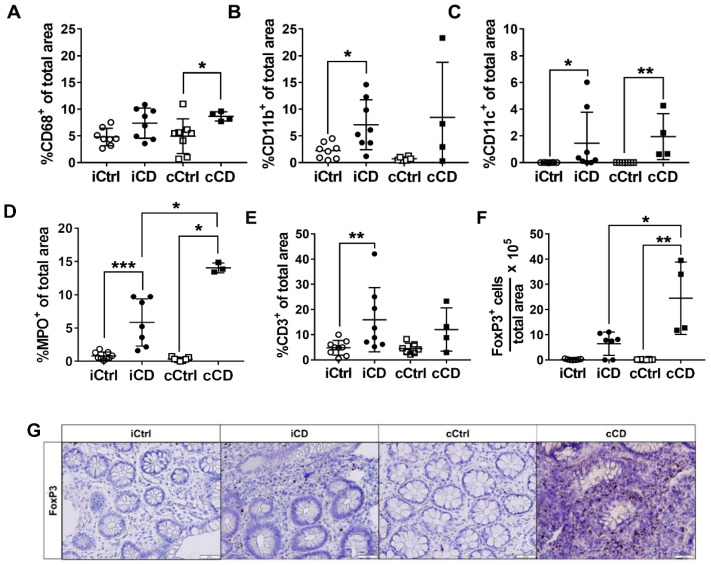
Figure 1.
Enhanced immune cell infiltration in intestinal tissue of patients with active CD. Differential quantitative and localization-dependent evaluation of the area percentages of (A) CD68+, (B) CD11b+, (C) CD11c+, (D) MPO+, (E) CD3+ and (F) FoxP3+. (G) Analysis of FoxP3 expression in paraffin-embedded tissue samples of patients with CD (representative images, magnification 20×). Inflamed tissue of patients with iCD and cCD were compared with noninflamed control (ctrl) samples. For the analysis of FoxP3, we determined the ratio of counted cells to the total area (µm2) and multiplied with 105 for better visualization. (A–F) Data are shown as mean ± SD of n = 4–9 for different patient groups and controls; * for p ≤ 0.05, ** for p < 0.01, and *** for p < 0.001 using the Mann–Whitney test. cCD = colonic CD, cCtrl = colon non-IBD control, iCD = ileal CD, iCtrl = ileum non-IBD control.

