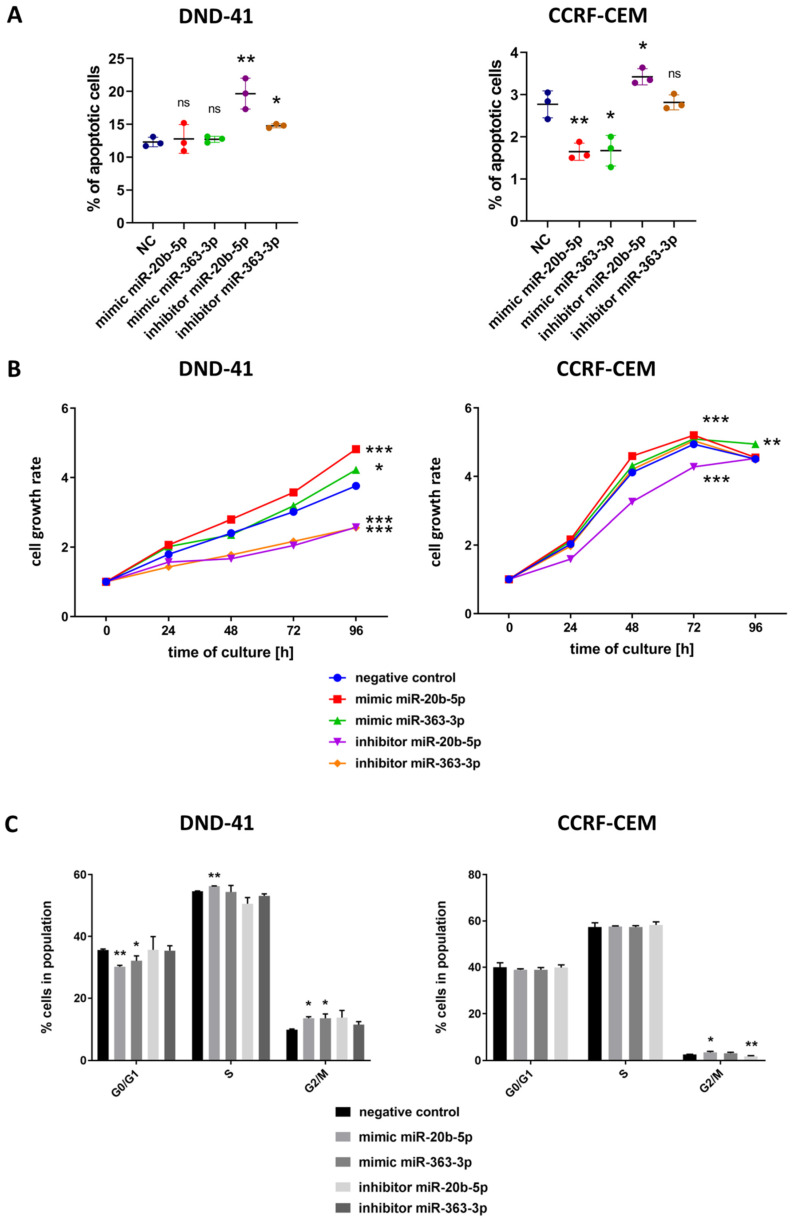
Figure 3.
Functional effect of inhibition and mimicry of hsa-miR-20b-5p and hsa-miR-363-3p on apoptosis (A), cell growth measured by colorimetric viability assay (B) and cell cycle distribution (C) of DND-41 and CCRF-CEM T-ALL cell lines. Cell growth rate (B) was calculated as fold change of OD450 for each examined time point in reference to the starting point (0 h). Scatter plots and bar plots present mean values of three biological replicates; error bars indicate standard deviation. *** p < 0.001; ** p < 0.01; * p < 0.05.

