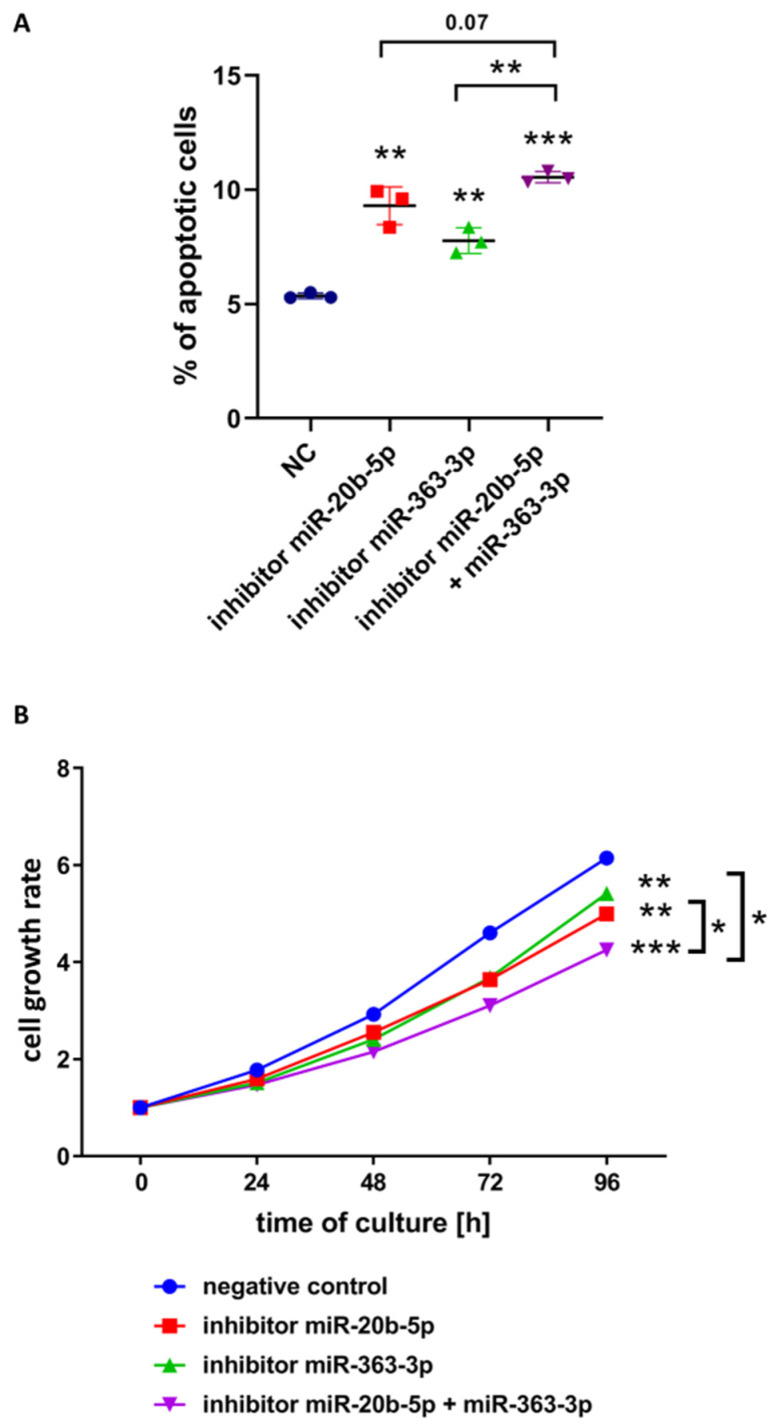
Figure 4.
Functional effect of simultaneous inhibition of hsa-miR-20b-5p and hsa-miR-363-3p as compared to negative control and to inhibition of single miRNAs in DND-41 T-ALL cell line. (A) Percentage of apoptotic cells in all examined variants. (B) Cell growth rate, measured by colorimetric viability assay and calculated as fold change of OD450 for each examined time point in reference to the starting point (0 h). Asterisks without brackets indicate the statistical significance of differences between negative control and each examined miRNA inhibition variant. Scatter plot presents mean values of three biological replicates; error bars indicate standard deviation. *** p < 0.001; ** p < 0.01; * p < 0.05.

