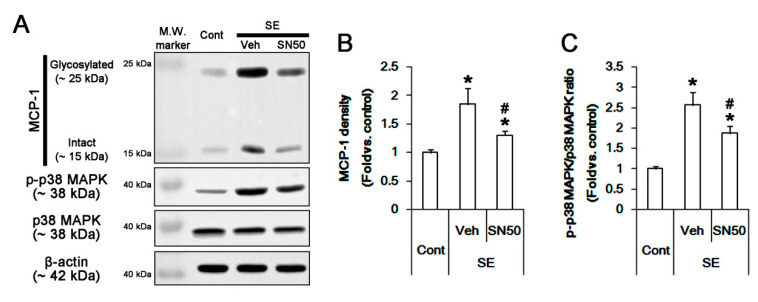
Figure 7.
The effect of SN50 on MCP-1 expression and p38 MAPK phosphorylation in the FPC following SE. SN50 decreases MCP1 induction and p38 MAPK phosphorylation without p38 MAPK expression level following SE. (A) Representative Western blot image for MCP-1, p-p38 MAPK, and p38 MAPK. (B,C) Quantification of the effect of SN50 on MCP1 induction (B) and p38 MAPK phosphorylation (C) based on Western blot data. Error bars indicate SEM (*,# p < 0.05 vs. control and vehicle, respectively; n = 7, respectively).

