Figure 5.
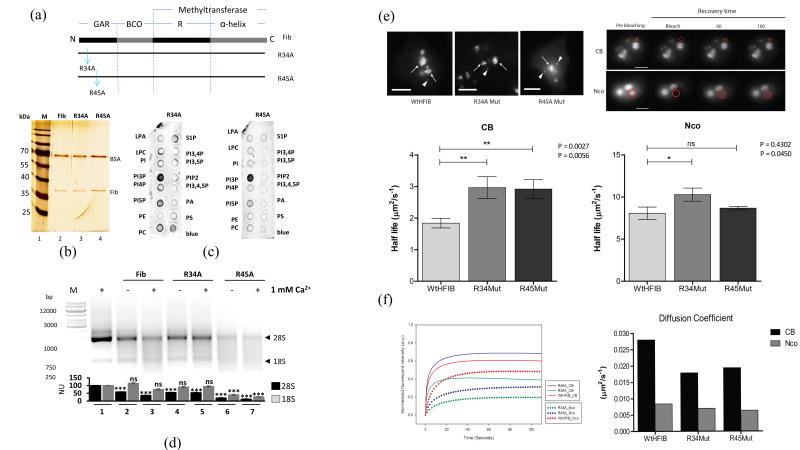
Activity of GAR domain mutants. (a) Schematic representation of fibrillarin domains GAR, BCO, and RNA binding alpha-helix domain. Blue arrows represent mutations R34A and R45A in the fibrillarin GAR domain. (b) Silver stain normalization of WT, R34A, and R45A fibrillarin. (c) Fat blot assay for fibrillarin mutants R34A and R45A. Figure S1 depicts the quantification signals made by ImageJ software. (d) RNA activity of fibrillarin mutants R34A and R45A. Quantification of 28S and 18S signals were made by ImageJ software and statistical significance was determined by t-test (* p-value < 0.05; ** p-value < 0.01; *** p-value < 0.001, ns = not significant p-value > 0.05) and plots are indicated below the gels from n = 3. (e) Transiently transfected HeLa cells expressing GFP-WT-fibrillarin, R34A, or R45A mutant coupled to GFP. In the upper left panel, representative images of the conventional localization of human fibrillarin in nucleoli (arrows) and Cajal bodies (arrowheads) are shown for WT and mutants. Intranuclear localization for WT fibrillarin and its mutants was observed in live cells. On the upper right panel, one representative photobleaching experiment is shown for a Cajal body and, for a nucleolus, red circles delimit the ROI, which was subsequently photobleached. The lower graphs plot the half-life coefficients obtained from 200 independent FRAP experiments comparing WT and mutants fibrillarins in CBs and NCOs; error bars correspond to SEM. (f) The left graph represents the normalized dynamics from 200 independent photobleaching events for WT and mutant fibrillarins in CBs and NCOs; the curves in the graphs represent the normalized values of the mean (n = 200) for each condition for each time point. The bar graph on the left shows a resume of the single diffusion coefficient values obtained from the previous analysis.

