Figure 7.
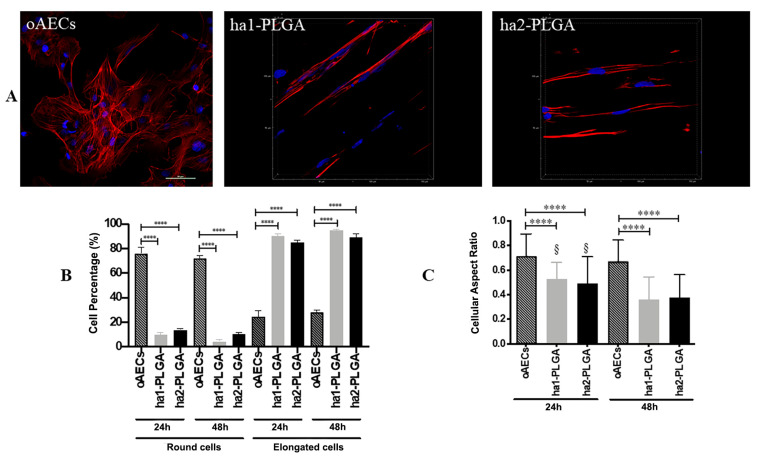
Morphology of oAECs on ha1-PLGA and ha2-PLGA fleeces. (A) Representative confocal images of oAECs morphology evidenced with phalloidin stain (red fluorescence) and nuclei counterstained with DAPI (blue fluorescence). It is evident that oAECs on Petri dishes maintain their typical epithelial shape, whereas they acquire a tenocyte-like elongated morphology already at 24 h culture on both ha1- and ha2-PLGA fleeces. Scale bar = 50 µm. (B) Percentage of the elongated oAECs after 24 h and 48 h seeding on ha-PLGA fleeces. **** Statistically significant values between the different studied groups at each time point (p < 0.0001). (C) Percentage of the cell nuclei aspect ratio after 24 h and 48 h seeding on ha1-PLGA and ha2-PLGA fleeces. **** Statistically significant values between the different studied groups at each time point (p < 0.0001). § Statistically significant values within the same group at different time points (p < 0.0001) (n = 3 for each type of fleece/analysis, fleece size: 15 mm × 7 mm).

