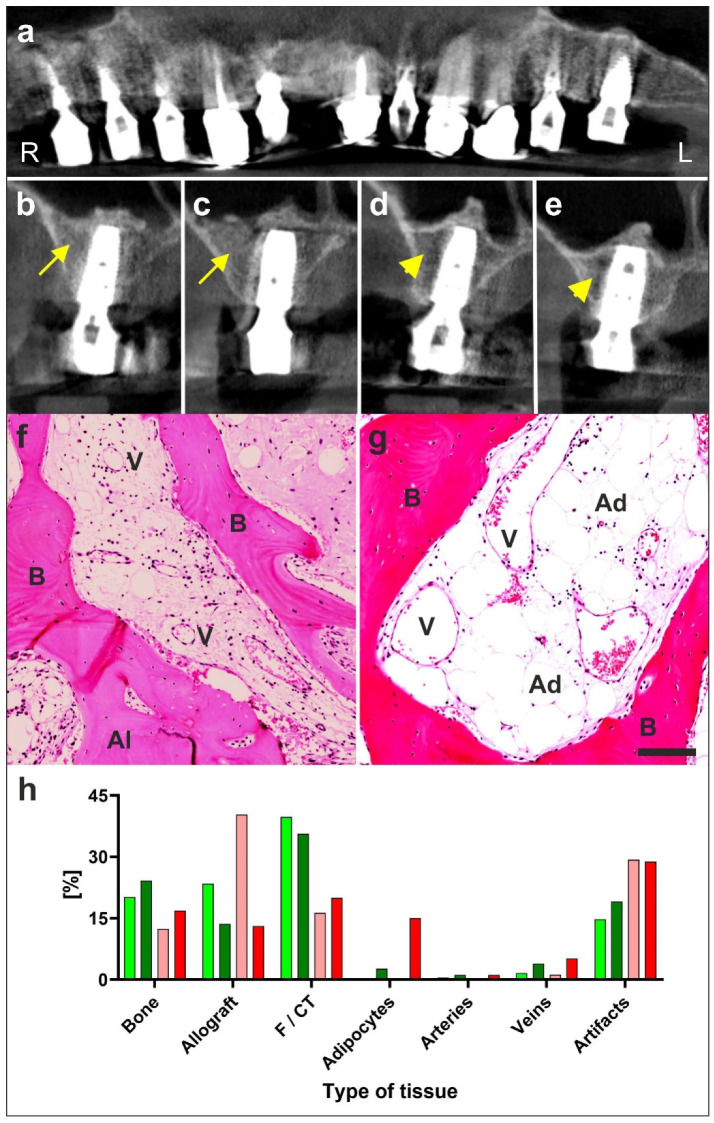
Figure 4.
Example of regeneration of bone with UA-ADRCs (modified from [7]). Details are provided in the main text. (a–e) digital volume tomography radiographs taken 1 year after the placement of implants and 20 months after guided bone regeneration-maxillary sinus augmentation. Panel a provides a panoramic view; Panels (b–e) show detailed views on selected regions. With the application of unmodified autologous adipose-derived regenerative cells (UA-ADRCs) the bone around the implants in regions B and C appears larger in area and denser (yellow arrows in (b,c)) than without the application of UA-ADRCs in (d,e) (yellow arrowheads in (d,e)). (f,g) Photomicrographs of bone biopsies taken at six weeks (W6) post treatment with application of cells (f) or without cells (g). (h) Results of histomorphometric analysis of bone biopsies taken at W6 (light green and orange bars) and W34 (dark green and red bars) post treatment with application of cells (green bars) or without cells (orange and red bars). Abbreviations: R, right; L, left; B, bone; Al, allograft; V, vein; Ad, adipocyte; F/CT, fibrin and connective tissue. With cells there was considerably more bone and connective tissue formed already at six weeks than was achieved without cells even after six months. The scale bar in g represents 100 µm.

