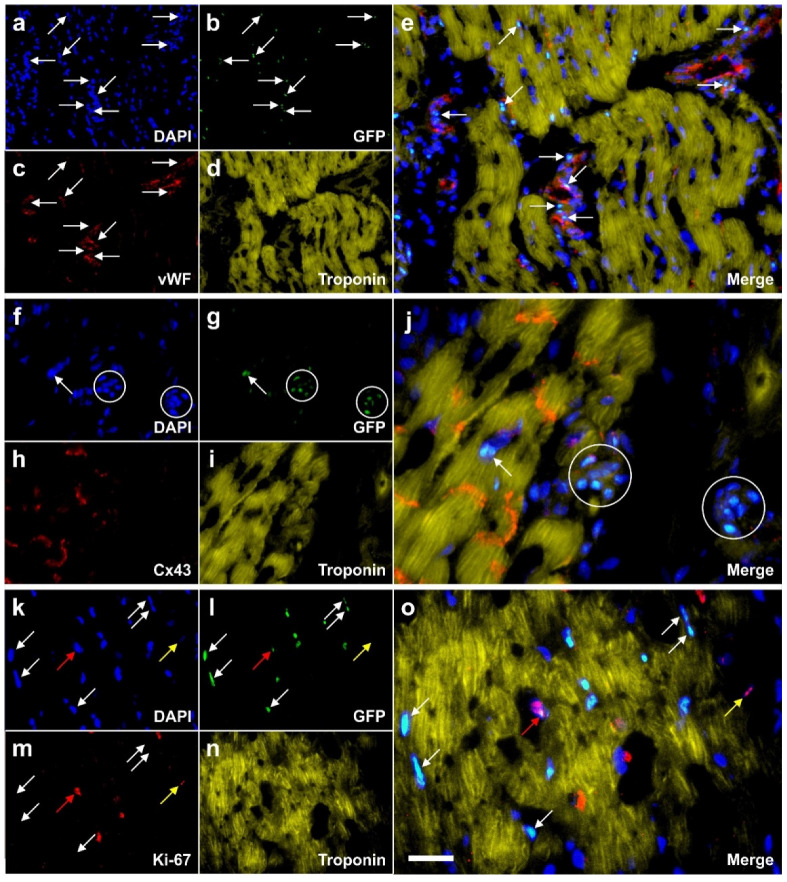
Figure 6.
Representative, previously unpublished example how autologous, adipose derived stem cells can stay locally, survive and engraft in the new host tissue into which the cells were applied, differentiate under guidance of the new microenvironment, integrate into the new host tissue and participate in building new vascular structures in the host tissue. The panels show photomicrographs of paraffin-embedded, 5 µm thick tissue sections of a post mortem heart from a pig, taken from the left ventricular border zone of myocardial infarction ten weeks after experimental occlusion of the left anterior descending (LAD) artery for three hours, followed by delivery of eGFP-labeled autologous ASCs into the balloon-blocked LAD vein (matching the initial LAD occlusion site) at four weeks after occlusion of the LAD (experiments are described in detail in [111]). (a–e) One tissue section was stained with DAPI (blue) (a) and processed for immunofluorescent detection of GFP (green) (b), von Willebrand factor (vWF) (red) (c) and Troponin (yellow) (d). The arrows indicate cell nuclei that were immunopositive for GFP and were found in the wall of small vessels (the positions of these cell nuclei are also labeled in the panel representing vWF). (f–j) Another tissue section was was stained with DAPI (blue) (f) and processed for immunofluorescent detection of GFP (green) (g), Cx43 (red) (h) and Troponin (yellow) (i). The circles indicate regions where most of the cell nuclei were immunopositive for GFP, and the arrow a GFP-positive cell nucleus inside (or directly adjacent to) a cardiomyocyte. (k–o). A third tissue section was stained with DAPI (blue) (k) and processed for immunofluorescent detection of GFP (green) (l), Ki-67 (red) (m) and Troponin (yellow) (n). The white arrows point to cell nuclei that were immunopositive for GFP but not for Ki-67, the yellow arrows to a cell nucleus that was immunopositive for Ki-67 but not for GFP, and the red arrows to a cell nucleus that was immunopositive for both GFP and Ki-67 (indicating that this cell had re-entered the cell cycle). The scale bar represents 25 µm in the merged panels and 50 µm in the individual panels.

