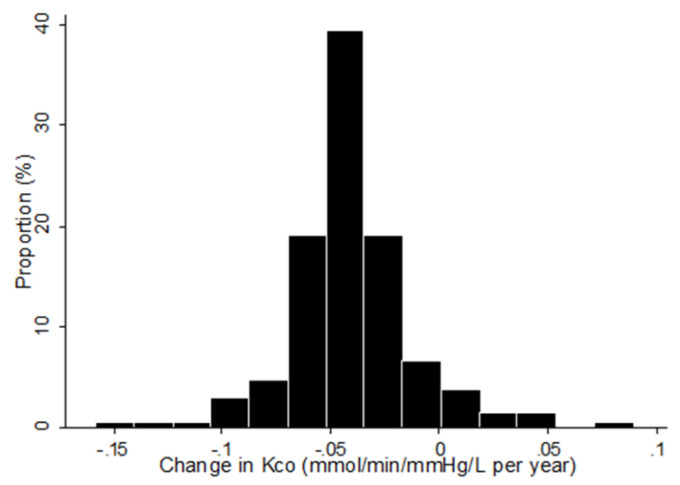
Figure 2.
Distribution of estimated annual rates of change in Kco (n = 211). Footnotes: Best Linear Unbiased Prediction (BLUP) of the annual change in Kco was calculated for each patient using the random-coefficient model, and the data are shown as a histogram. Mean ± SD = −0.04 ± 0.03 (mmol/min/mmHg/L per year).

