Figure 3.
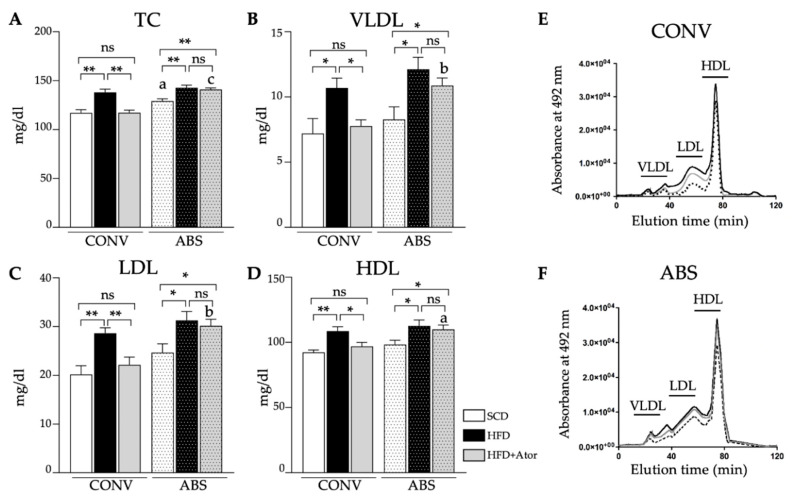
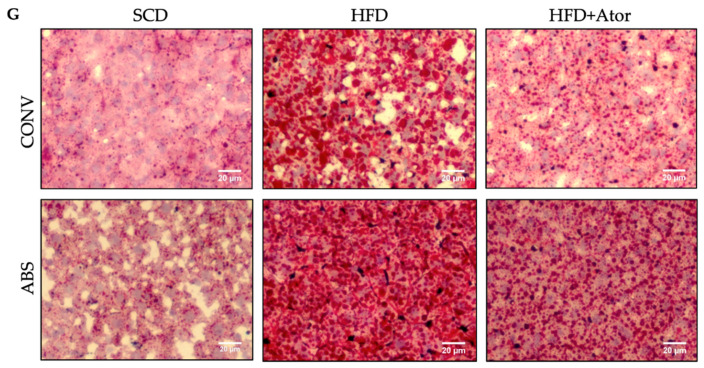
Analysis of plasma lipids. (A–D): Alterations of blood lipids in CONV (n = 14) and ABS (n = 13) mice under SCD or HFD and atorvastatin (Ator). (E,F): Representative HPLC plots of CONV (E) and ABS mice (F,G): Representative liver sections stained with hematoxylin-eosin and oil red o. Error bars indicate SEM. * = p < 0.05; ** = p < 0.01.


