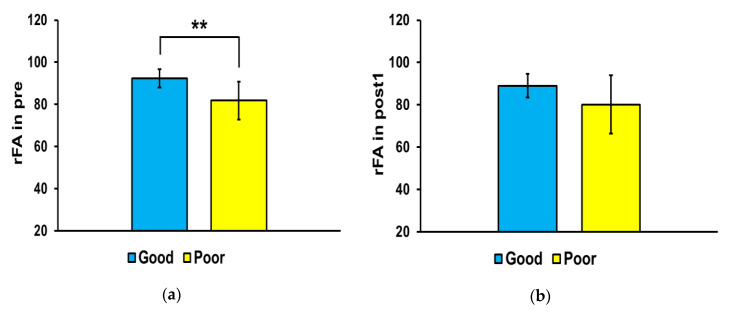
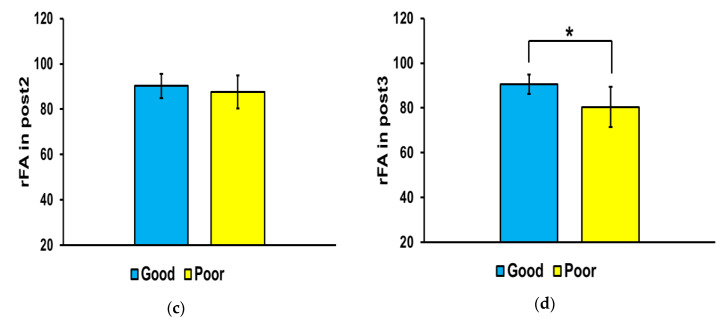
Figure 4.
Mean fractional anisotropy (FA) ratios in the corticospinal tract. In the affected side, the mean FA ratio was significantly higher in the good outcome group than that in the poor outcome group at pre (* p < 0.01) and post3 (* p < 0.05). Abbreviations: (a) baseline (pre), (b) 3 weeks after stroke onset (post1), (c) 3 months (post2), and (d) 6 months (post3). ** p < 0.01.


