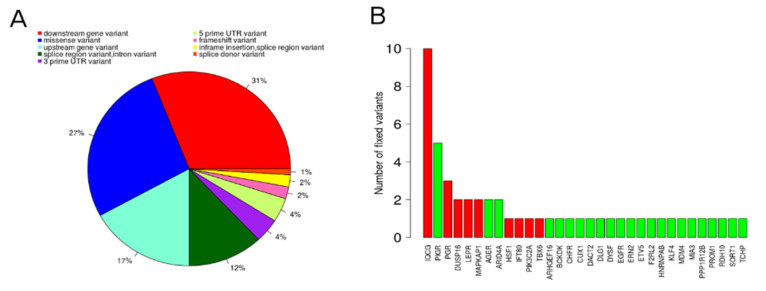
Figure 4.
Percentage of each functional consequence annotated (A) and number of fixed variants per each functional candidate gene (B). The red bars in B represent genes where the fixed variants were identified in sub-fertile animals, while the green bars represent those variants fixed in high-fertile animals.

