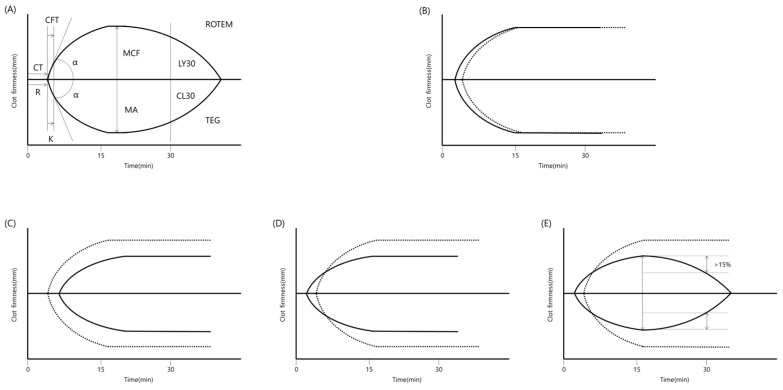
Figure 1.
Schematic examples of thromboelastography (TEG). (A) Typical waveform of TEG. Terms in the upper wave are used in ROTEM and terms in lower wave are used in TEG. (B) Procoagulant effect with decreased delay of coagulation initiation and preservation of clot strength. (C) Anticoagulant effect with increased delay of coagulation initiation and decreased clot strength, (D) Pseudoprocoagulant effect with decreased delay of coagulation initiation and decreased clot strength, (E) Fibrinolysis effect with a delayed decrease in the clot strength by >15%. The dotted line indicates the normal presentation. CT, coagulation time, CTF, clot formation time, MCF, maximal clot firmness, α, slope between CT and CFT, LY30 or R and K, lysis after 30 min, R, time of latency to initial fibrin formation, K, time to get amplitude of 20 mm, MA, maximal amplitude, CL30, clot lysis after 30 min.

