Figure 4.
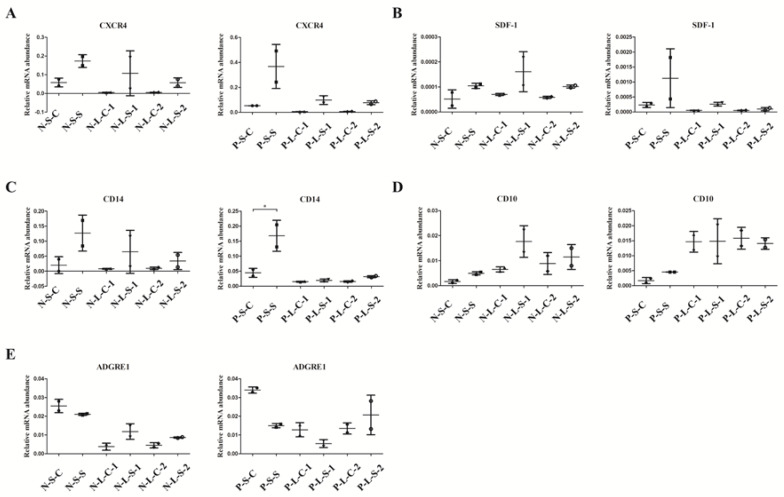
Gene expression in vitro demonstrating the positive relationship between CD14 and CXCR4. (A-C) The gene expression of CXCR4 (A) and SDF-1 (B) showed similar trends to that of CD14 (C). Short-term cultured BMCs showed increased CD14 expression in PAH rats, while long-term cultured BMCs did not (C). (D,E) The gene expression of CD10 (D) and ADGRE1 (E) did not show similar trends to those of CXCR4 (A) and SDF-1 (B). N-S-C: normal-short-control culture, N-S-S: normal-short-silibinin culture, N-L-C-1: normal-long-control 1 culture, N-L-S-1: normal-long-silibinin-1 culture, N-L-C-2: normal-long-control 2 culture, N-L-S-2: normal-long-silibinin-2 culture, P-S-C: PAH-short-control culture, P-S-S: PAH-short-silibinin culture, P-L-C-1: PAH-long-control 1 culture, P-L-S-1: PAH-long-silibinin-1 culture, P-L-C-2: PAH-long-control 2 culture, P-L-S-2: PAH-long-silibinin-2 culture, * p < 0.05. Treatment cultures consisted of two samples in each group.

