Figure 1.
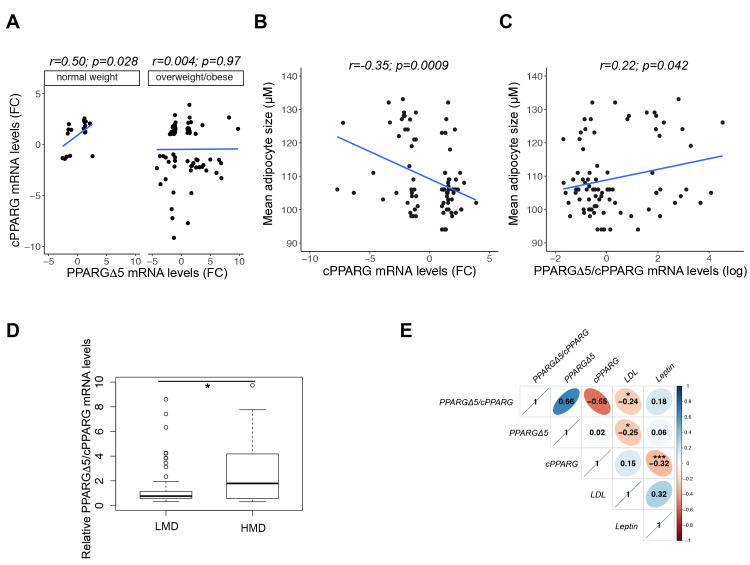
PPARGΔ5/cPPARG ratio correlates with adipocyte size, leptin and low density lipoprotein (LDL) cholesterol serum levels. Expression values of PPARGΔ5 and cPPARG have been previously measured in subcutaneous adipose tissue (SAT) of patients from a German cohort [16]. (A) Scatterplot reporting the correlation (linear regression analysis) between PPARGΔ5 and cPPARG expression levels in normal weight (n = 20) and overweight/obese individuals (n = 74). Pearson correlation coefficient (r) and p values (p) are shown. (B–C) Scatterplot resulting from regression analysis and indicating that cPPARG (B) and PPARGΔ5/cPPARG (C) levels oppositely correlate with mean diameter of subcutaneous adipocyte size (n = 86). Pearson correlation coefficient (r) and p values (p) are shown. (D) Boxplot showing PPARGΔ5/cPPARG levels in two subgroups, defined according to the mean diameter of subcutaneous adipocytes as “Low Mean Diameter” (LMD; mean diameter < 115μm, n = 63) and “High Mean Diameter” (HMD; mean diameter >115μm, n = 23) group. *p < 0.05. (E) Correlation plot indicating Pearson’s correlation coefficient and p value (* p < 0.05, *** p < 0.0001) among cPPARG, PPARGΔ5, PPARGΔ5/cPPARG, leptin (n = 61), and LDL serum levels (n = 59).

