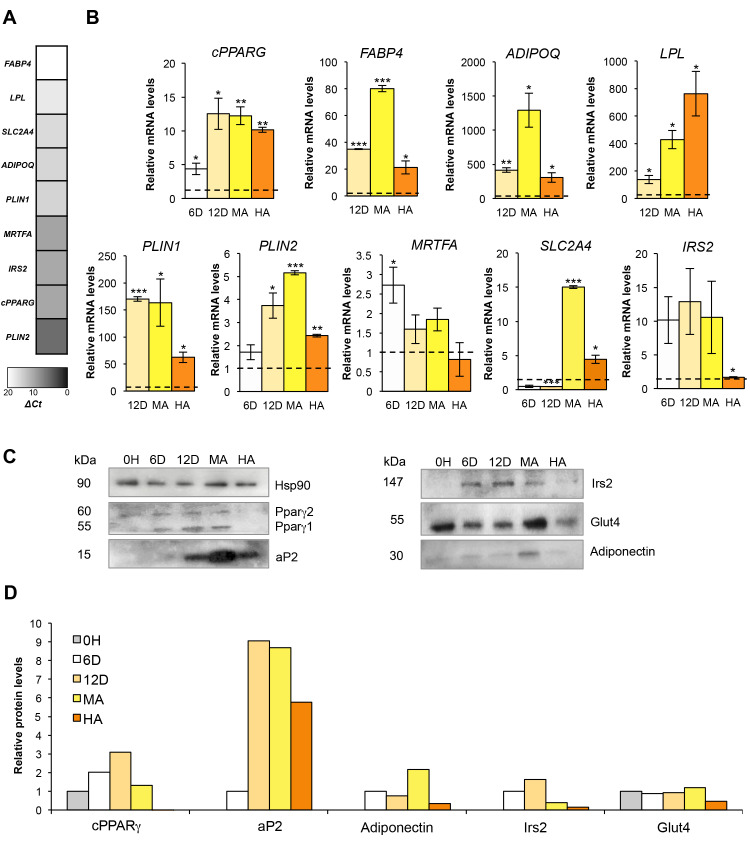
Figure 4.
Expression analysis along differentiation of hMSCs in mature and hypertrophic-like adipocytes. (A) Gray-scale heatmap of normalized mRNA expression values (ΔCt = Ct gene – Ct PPIA) determined by qPCR in hMSCs (T = 0 h). PPIA was used as reference gene. (B) Relative mRNA expression analysis (qPCR) at different time points upon adipogenic induction (T = 0 h, T = 6 and T = 12 days) and in mature and hypertrophic-like adipocytes (MAs and HAs, respectively). For each gene, the first time point showing detectable levels was used as reference (dotted line; i.e., T = 0 h for PPARG, PLIN2, MRTFA, SLC2A4, IRS2 genes; T = 6 days for FABP4, ADIPOQ, LPL and PLIN1 genes). PPIA was used as reference gene in all assays. Data are reported as mean ±SEM from three independent experiments. *p val ≤ 0.05, **p val ≤ 0.01 and ***p val ≤ 0.001. (C) Western blots on lysates of hMSCs at different time points from adipogenic induction (T = 0 h, T = 6, and T = 12 days) and in MAs and HAs. Hsp90 was used as loading control. Representative autoradiographs are shown. (D) Bar graph reporting protein quantification (pixel density analysis of western blots). Values are normalized on Hsp90 (loading control) and—for each analyzed protein—the first time point having detectable levels (by the specific Ab) was used as reference (relative protein levels = 1).

