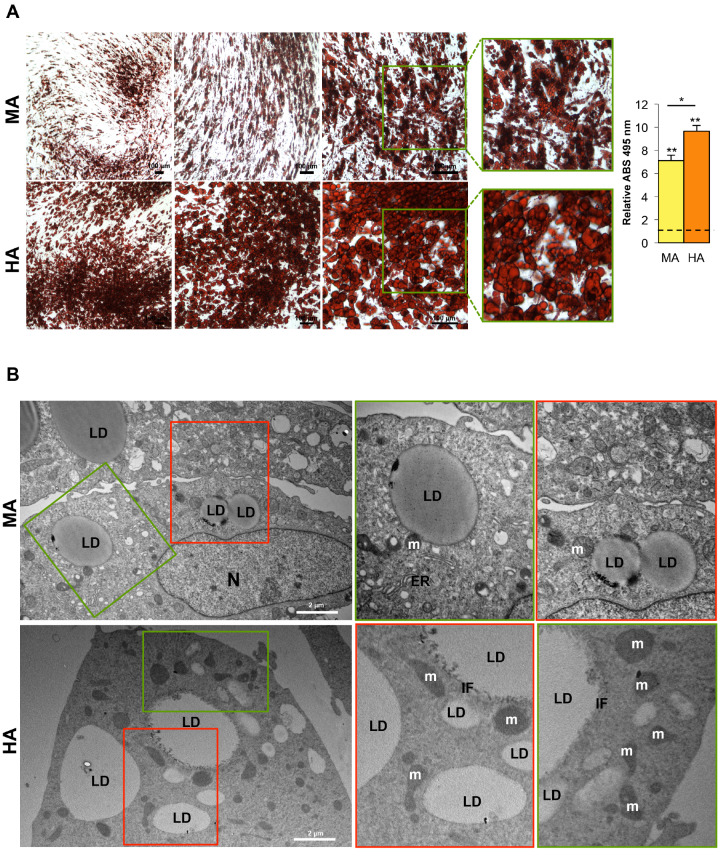
Figure 5.
Mature and hypertrophic-like adipocytes display morphological differences. (A) Representative images (left panel) of mature and hypertrophic-like adipocytes (MAs and HAs, respectively) stained with Oil Red O (scale bars, 100 µm). Measurement of lipid accumulation (optical density) in hMSCs (T = 0 h used as control, CTR), in MAs and in HAs. Data are shown as mean ± SEM vs. CTR (dotted line). *p val ≤ 0.05 and **p val ≤ 0.01. (B) Representative micrographs of MAs and HAs by transmission electron microscopy (scale bars, 2 µm). Green and red squares in each left panel are observed at higher magnification in right panels. n = nucleus; m = mitochondria, LD = lipid droplets, ER = endoplasmic reticulum, IF = intermediate filaments.

