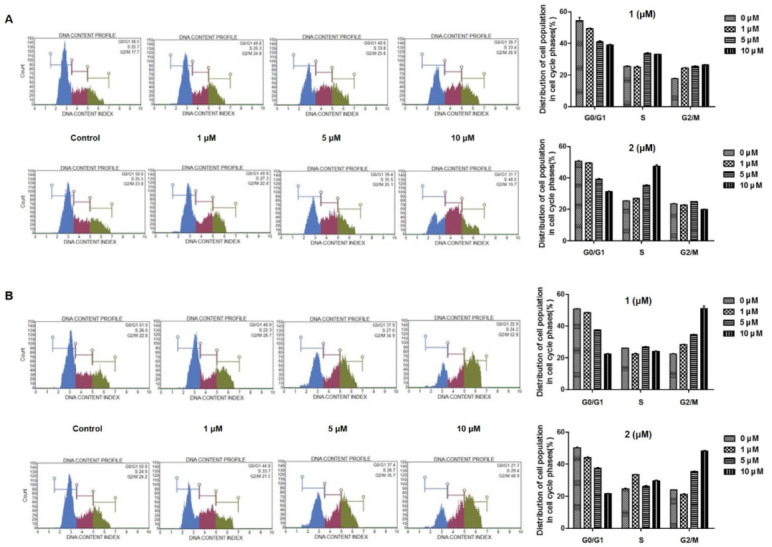
Figure 4.

Effects of 1 and 2 on cell cycle arrest in A549 (A) and HT-29 (B) cells. Cells were treated with control or various concentrations (1, 5, 10 µM) of each compound for 24 h and analyzed by flow cytometry. The percentage of cell cycle distribution is presented as the mean ± standard deviation from three independent experiments.
