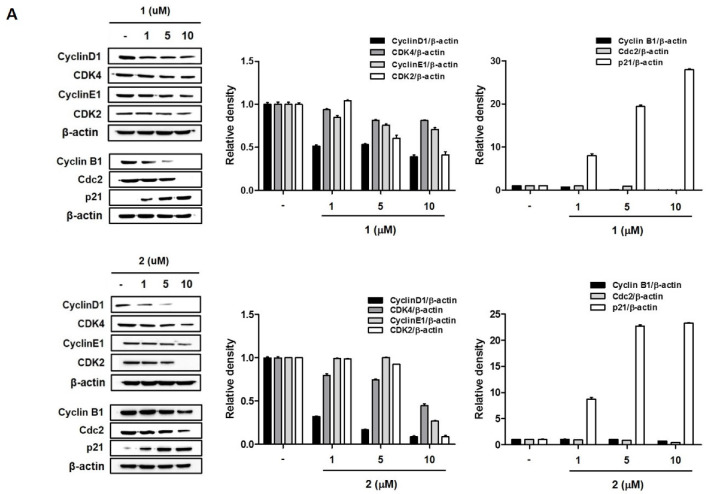
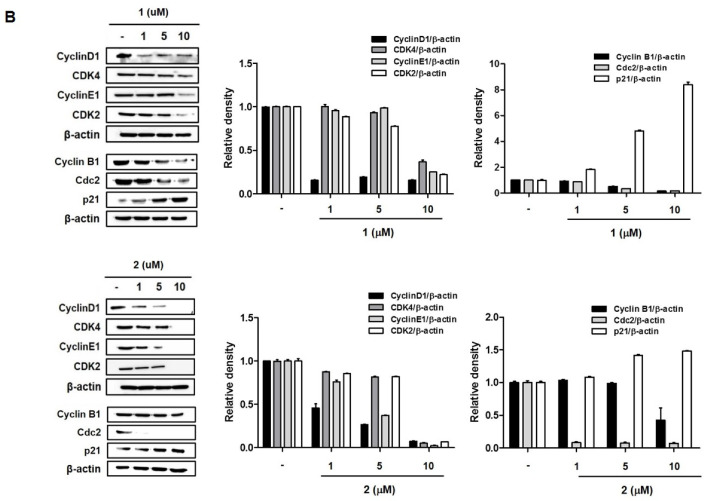
Figure 5.
The effects of 1 and 2 on the expression of cell cycle-regulated proteins in A549 (A) and HT-29 (B) cells. Cells were treated with control or various concentrations (1, 5, 10 µM) of each compound for 24 h, and the protein levels of cyclin D1, CDK4, cyclin E1, and CDK2 were measured by Western blotting. Results are presented as the mean ± standard deviation from three independent experiments. The representative blots are presented.


