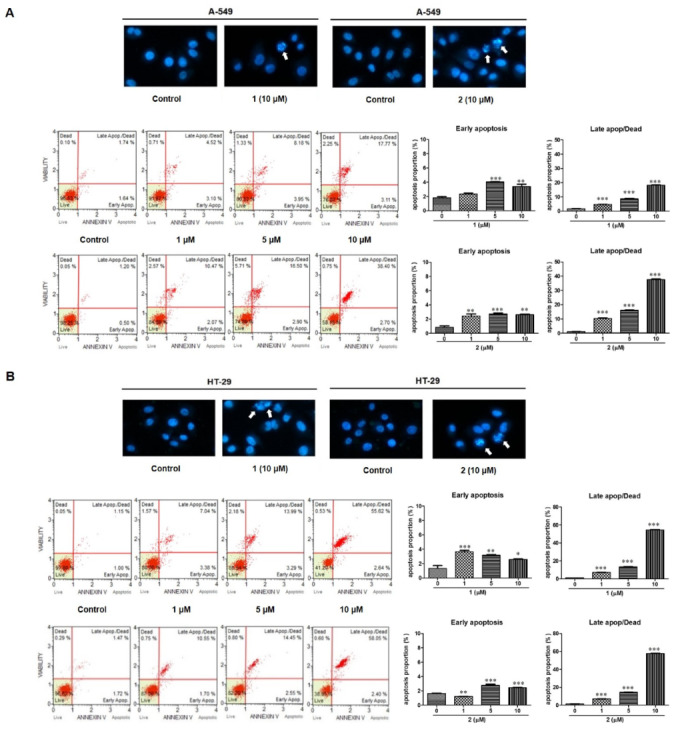
Figure 6.

Apoptosis was induced by 1 and 2 in A549 (A) and HT-29 (B) cells. Apoptotic morphological changes were evaluated by fluorescent microscopy using Hoechst 33342 staining. White arrow indicates nuclear fragmentation/apoptotic bodies. Apoptotic cell proportion was analyzed using MUSE flow cytometry. Cells were treated with various concentrations (1, 5, 10 µM) of each compound and stained with Annexin V-FITC/PI according to the manufacturer’s instructions. The representative charts present the proportion of apoptosis. The percentage of cells in early and late apoptosis/dead phases is presented as the mean ± standard deviation from three independent experiments; * p < 0.05, ** p < 0.01 and *** p < 0.001 compared to non-treated control cells.
