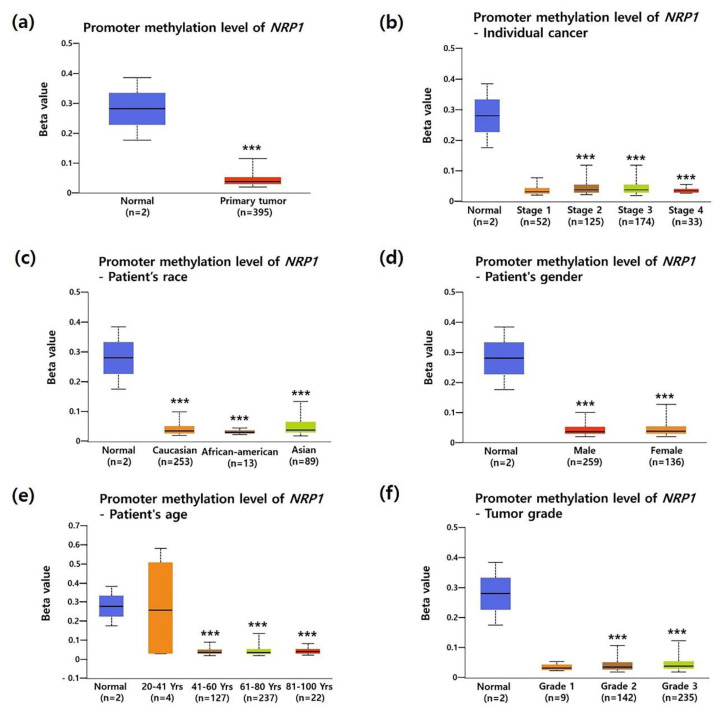
Figure 3.
Correlation between promoter methylation of the NRP1 and clinical parameters of patients with STAD. Promoter methylation level was expressed as box plots using the UALCAN database. Promoter methylation of NRP1 in STAD tumors (different color plot) and their normal tissues (blue plot) was shown according to the clinicopathologic parameters: (a) normal vs. primary tumor, (b) individual cancer stage, (c) patient race, (d) patient gender, (e) patient age, and (f) tumor grade. * P < 0.05, ** P < 0.01, *** P < 0.001.

