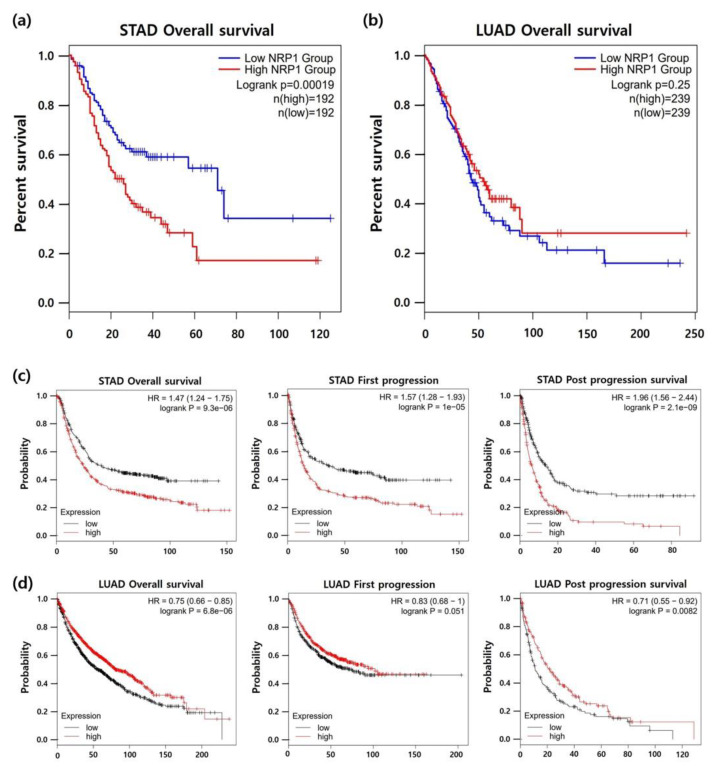
Figure 4.
Correlation between NRP1 expression and patient survival in STAD and lung adenocarcinoma (LUAD). Kaplan-Meier survival curves were generated using the GEPIA2 website. Patient’s survivals were compared between two groups divided at median value of NRP1 expression as higher (red) and lower (blue) in TCGA data. (a) STAD; n = 384, (b) LUAD; n = 478. Survival curves of overall survival (OS), first progression (FS), and post progression survival (PPS) in (c) STAD and (d) LUAD using Kaplan-Meier plotter with best cut-off option [35]. The prognostic value of NRP1 using TIMER database is presented in Supplementary Figure S3.

