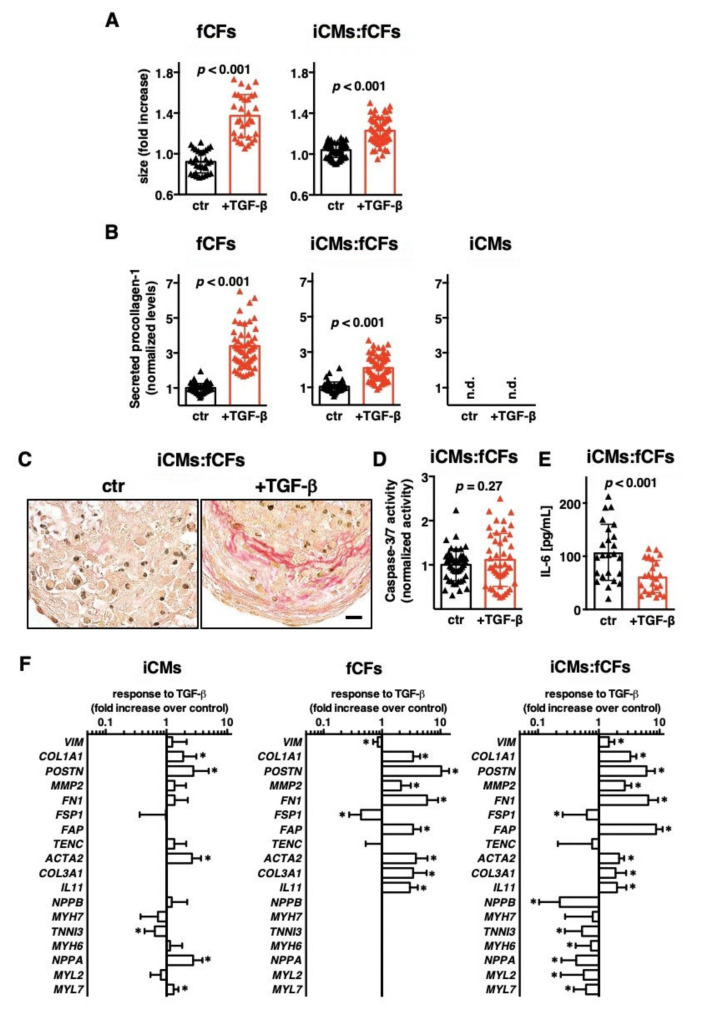
Figure 2.
TGF-β1 activates foetal cardiac fibroblasts in microtissues. Panel (A) demonstrates changes in size of microtissues generated with fCFs only (fCFs, left) and iCMs mixed with fCFs in ratio 4:1 (iCMs:fCFs, right) cultured in the presence (red) or absence (black) of TGF-β1 (10 ng/mL) for 10 days. Panel (B) shows relative levels of procollagen I (measured by ELISA), at day 10 in supernatants of all three microtissue types: fCFs (left), iCMs:fCFs (middle) and iCMs (right). Graphs show cumulative data of 2–5 independent experiments. Each dot represents data of one microtissue. Panel (C) illustrates representative picrosirius red staining in iCMs:fCFs microtissues at day 10 (bar = 10 μm). Panel (D) shows caspase 3/7 activity measured at day 10 in iCMs:fCFs microtissues. Graphs show cumulative data of 3 independent experiments. Panel (E) shows IL-6 levels measured by ELISA, at day 10 in supernatants of iCMs:fCFs microtissues. Graphs show cumulative data of 3 independent experiments. Each triangle represents data of one microtissue. Panel (F) summarizes fold changes in gene expression in indicated microtissues in the presence of TGF-β1 (in relation to expression in the absence of TGF-β1). * p < 0.05. Graphs show cumulative data of 3–4 independent experiments, n = 11–20. For all graphs, p values were calculated with the Student’s t-test. n.d.—not detected.

