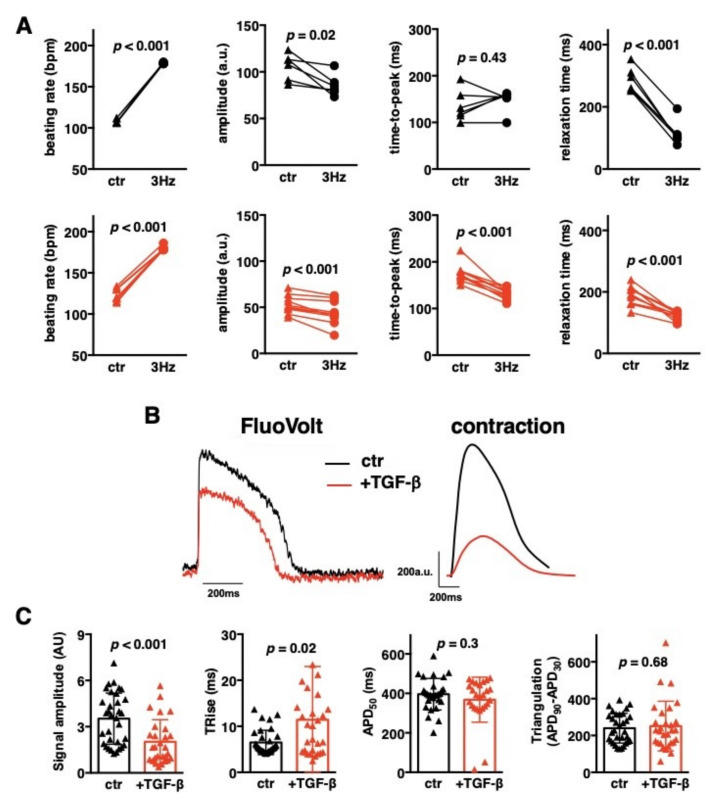
Figure 6.
Cardiac microtissue electrophysiology. iCMs:fCFs microtissues were cultured in the presence (red) or absence (black) of TGF-β1 (10 ng/mL) for 10 days. Panel (A) shows quantifications of the contraction parameters recorded during spontaneous contractile activity (triangles, ctr) and then upon electrical stimulation with 3 Hz (circles, 3 Hz). Each dot represents data for one microtissue at the indicated condition, lines match data obtained from the same microtissue. p values were calculated with the paired Student’s t-test. Panel (B) illustrates representative action potentials recorded with FluoVolt probe (left) and the respective contractions (right). Quantifications of action potential parameters are shown in panel (C). Graphs show cumulative data of 3 independent experiments. Each dot represents data for one microtissue. p values were calculated with the Student’s t-test. APD—action potential duration, TRise—depolarisation phase.

