Figure 4.
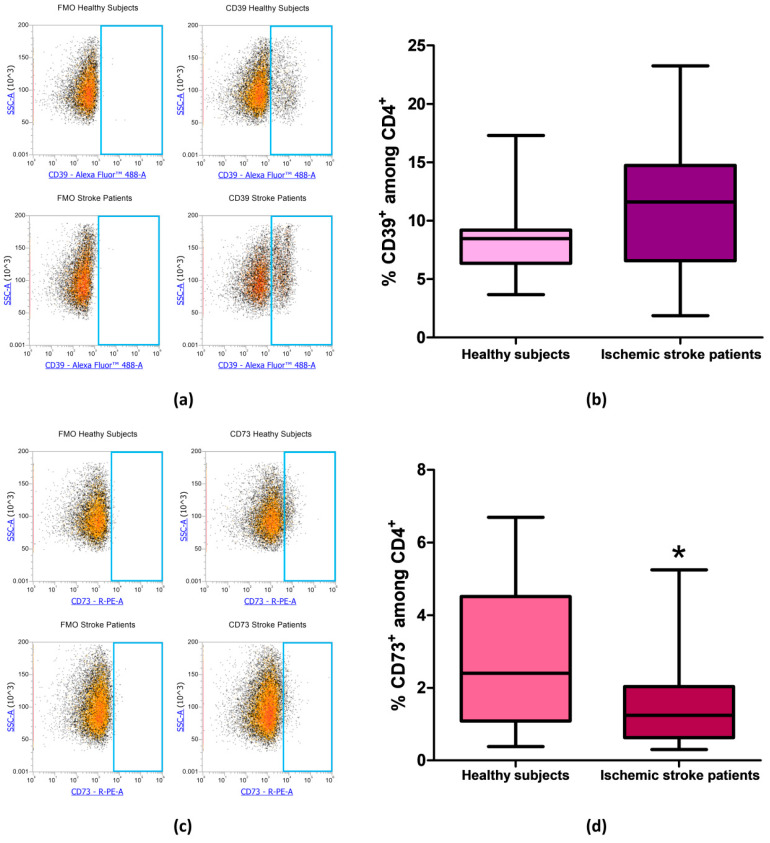
(a) Representative flow cytometry density plots showing FMO control and CD39 stained cells in CD4+ lymphocytes from healthy subjects and ischemic stroke patients. (b) Graphical representation of flow cytometry data showing the CD39+ percentage of CD4+ lymphocytes in healthy subjects (n = 20) and ischemic stroke patients (n = 21). (c) Exemplary density plots showing FMO control and CD73 stained cells in CD4+ lymphocytes from healthy subjects and ischemic stroke patients. (d) Box and Whiskers plot showing the proportion of CD73+cells among CD4+ lymphocytes in healthy subjects (n = 20) and ischemic stroke patients (n = 21). Data are shown as the median, interquartile range and the minimum and maximum values. * p < 0.05 vs healthy subjects.

