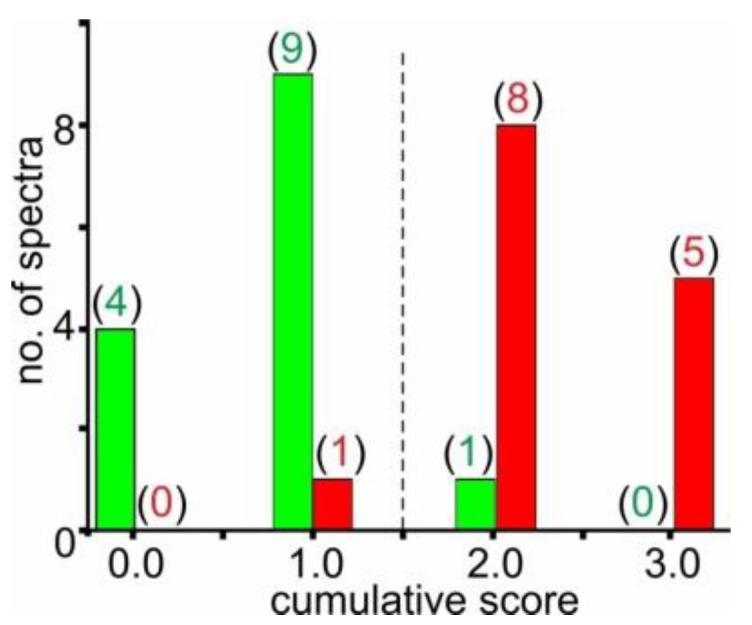
Figure 2.

Distribution pattern of cumulative scores with training set “O”. Cumulative score values range between “0.0” and “3.0”. Spectra of training set “O” (first measurement series, MS1, of CTRL I and FGR I serum samples; n = 28) are represented. Green bars represent spectra of CTRL I (patients 101–114) and red bars represent spectra of FGR I (patients 301–314, see Supplemental Table S2). Numbers in parentheses indicate numbers of spectra with the respective cumulative score. The vertical dashed line marks the cumulative score cut-off value which sorts the spectra, which is the respective samples, into either the FGR group (right) or the CTRL group (left).
