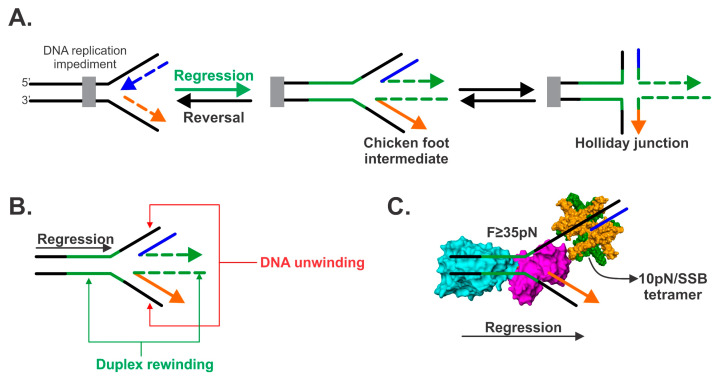
Figure 1.
Fork regression. (A). Fork regression occurs in a direction opposite to that of DNA replication. An impeded fork is shown with the nascent leading and lagging strands colored blue and orange, respectively. Fork regression involves unwinding of these nascent duplex regions, concomitant with the extrusion of two duplex regions colored in green. The resulting DNA structure is known as the “chicken foot” and is structurally similar to a Holliday junction. Fork reversal (indicated by the balck arrow) results in leftward movement of the fork and an occur only once regression and subsequent impediment repair have taken palce. (B). Fork regression requires that DNA unwinding be coupled to duplex rewinding. (C). The RecG DNA helicase is shown in the process of fork regression where it couples DNA unwinding to duplex rewinding and displacement of the single-strand binding protein (SSB) protein. RecG and SSB are represented as Connolly surfaces. The wedge domain of RecG is colored purple and the helicase domains in cyan. SSB monomers are colored orange and green.

