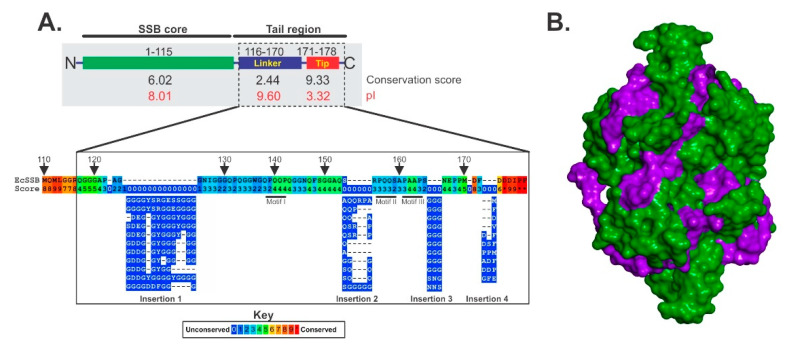
Figure 2.
Organization of the SSB protein. (A), Schematic of SSB divided into the core and tail regions by proteolytic cleavage. The conservation scores for each region were calculated from alignments using Praline [61]. The pI of each region is shown in red and was calculated using the ProtParam tool of Expasy [62]. The pI of the intact protein is 5.44. (B), The SSB tetramer is intimately associated with ssDNA. The image was generated using PDB file 1EYG [58]. The DNA is colored purple and the tetramer, is colored green. Both protein and DNA are represented as Connolly surfaces.

