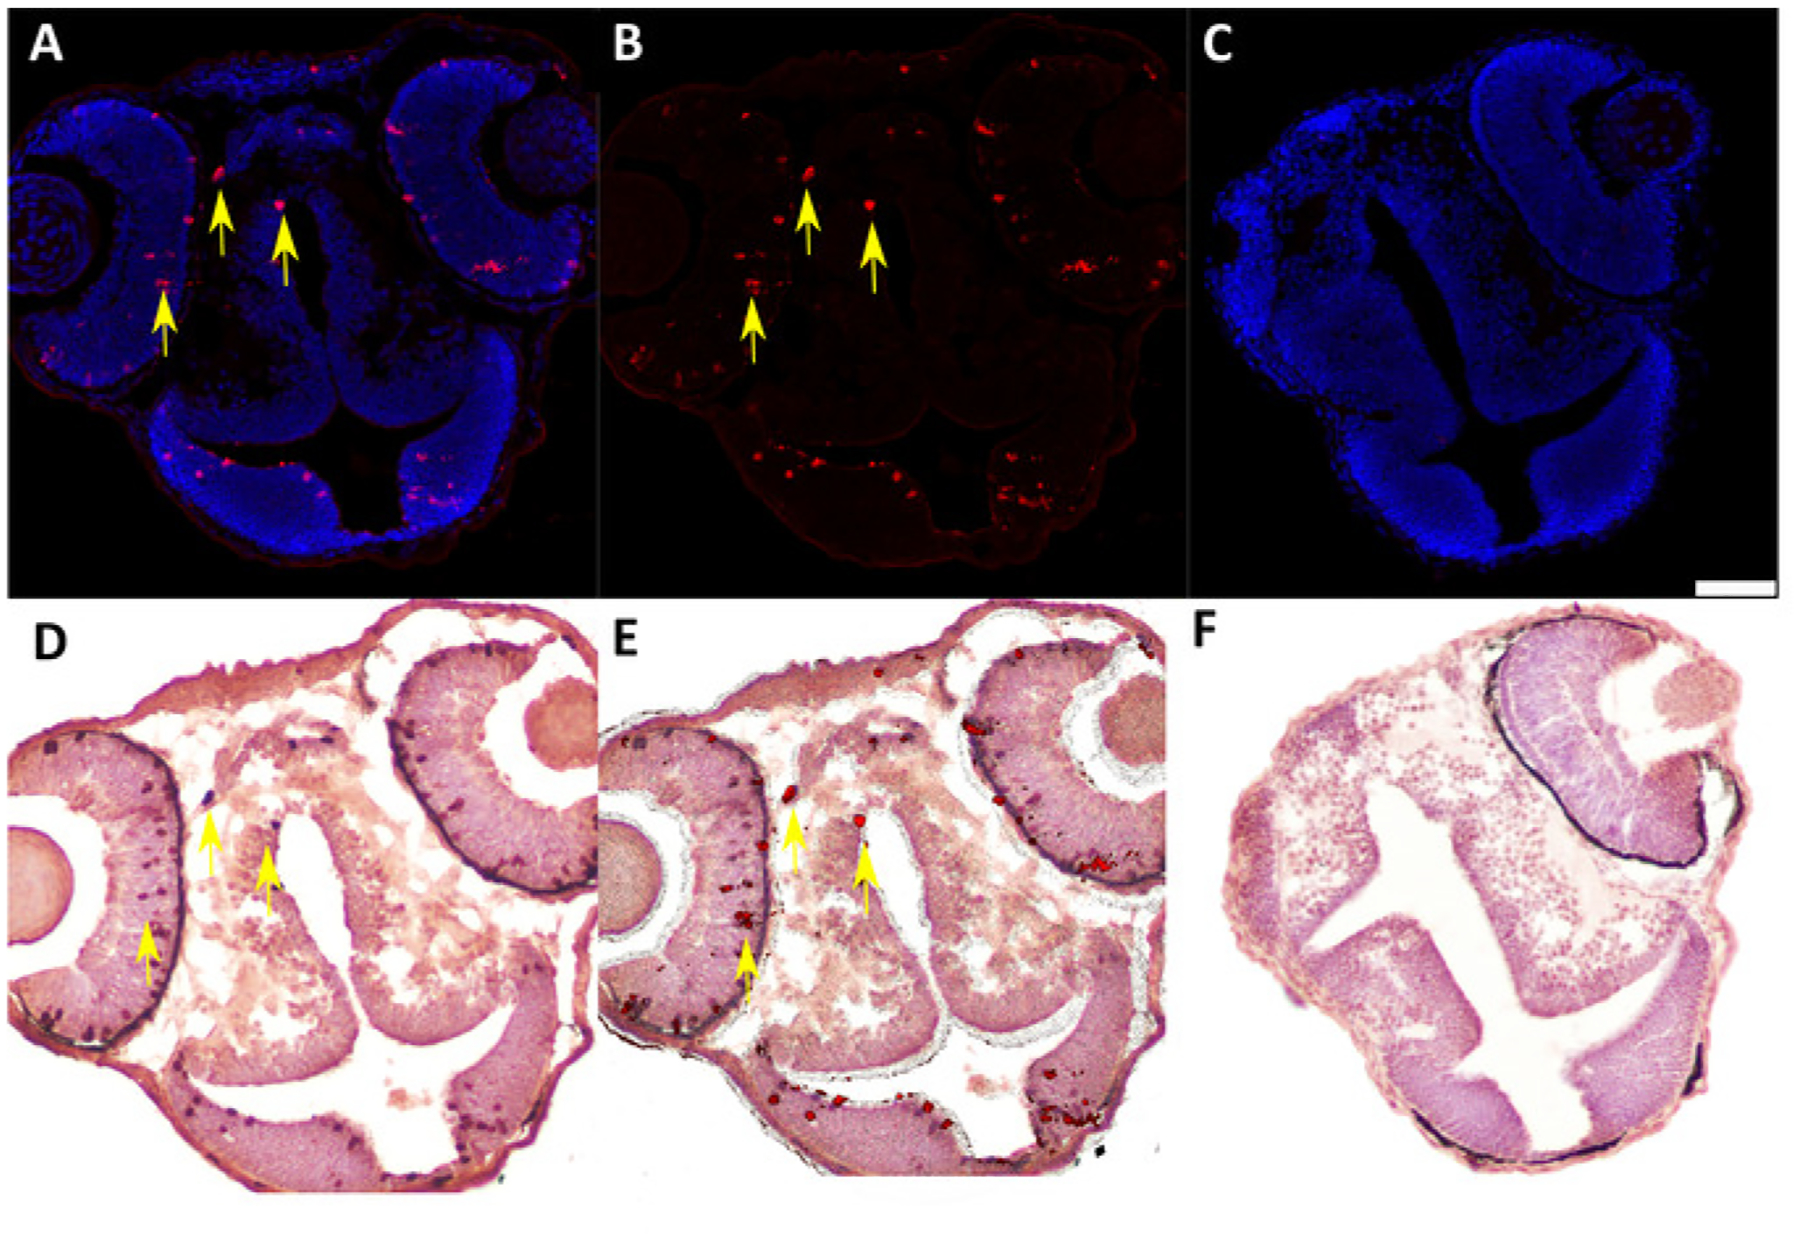
Figure 5: Representative IF and IHC labeling of cryosectioned 48 hpf chimeric zebrafish embryos generated by blastula-to-blastula transplant between AB wild-type zebrafish embryos.

(A) IF to detect Ser 10 phosphorylated Histone H3 (anti-pH3, 1:200) expression in 48 hpf chimeric zebrafish embryo. Red = pH3-positive cells; blue = nuclei. Yellow arrows indicate examples of positive cells. (B) Subtraction of the blue nuclear stain in the digital image (ImageJ software) enhances visualization of pH3-positive cells for quantification and image overlay. (C) Negative control (secondary antibody only) for IF assay in cryosectioned 48 hpf chimeric zebrafish embryo. Scale bar represents 50 μm (applicable to all panels). (D) IHC to detect labeled dextran (anti-labeled dextran, 1:7,500) in chimeric 48 hpf zebrafish embryo generated by blastula-to-blastula transplant between AB wild-type zebrafish embryos. Donor embryos were injected with a fluorescently labeled dextran conjugate at the one-cell stage prior to use for blastula-to-blastula transplant. Red indicates cells labeled with a dextran conjugate; blue indicates nuclei. Yellow arrows indicate examples of positive cells. (E) Overlay of panel B (IF for pH3) and panel C (IHC for labeled dextran) showing colocalization of pH3 expression and dextran labeling in individual cells. Yellow arrows indicate examples of double-positive cells. (F) Negative control (secondary antibody only) for IHC assay in cryosectioned 48 hpf chimeric zebrafish embryo.
