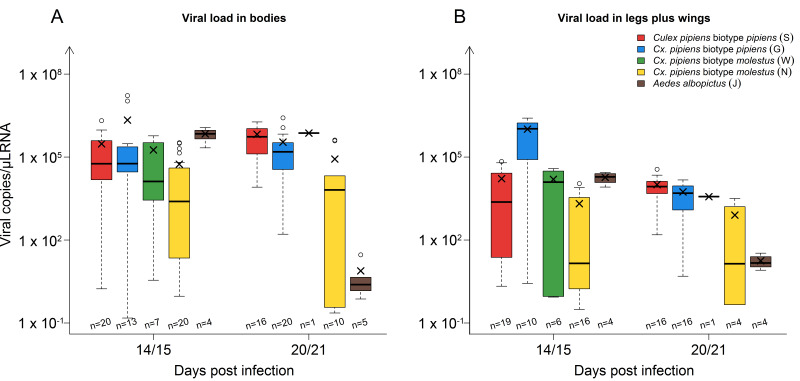
Figure 2.
Viral load in mosquito bodies (A) and legs plus wings (B) 14/15 and 20/21 days post infection in the different strains: Culex pipiens biotype pipiens, Cx. pipiens biotype molestus, and Aedes albopictus. The horizontal black lines represent the medians, the black ×’s the means, the boxes show the interquartile ranges, and the whiskers the minimum and maximum values. Data falling outside the interquartile ranges are plotted as outliers (o). The number of samples tested per species/time point are indicated above the x-axis.

