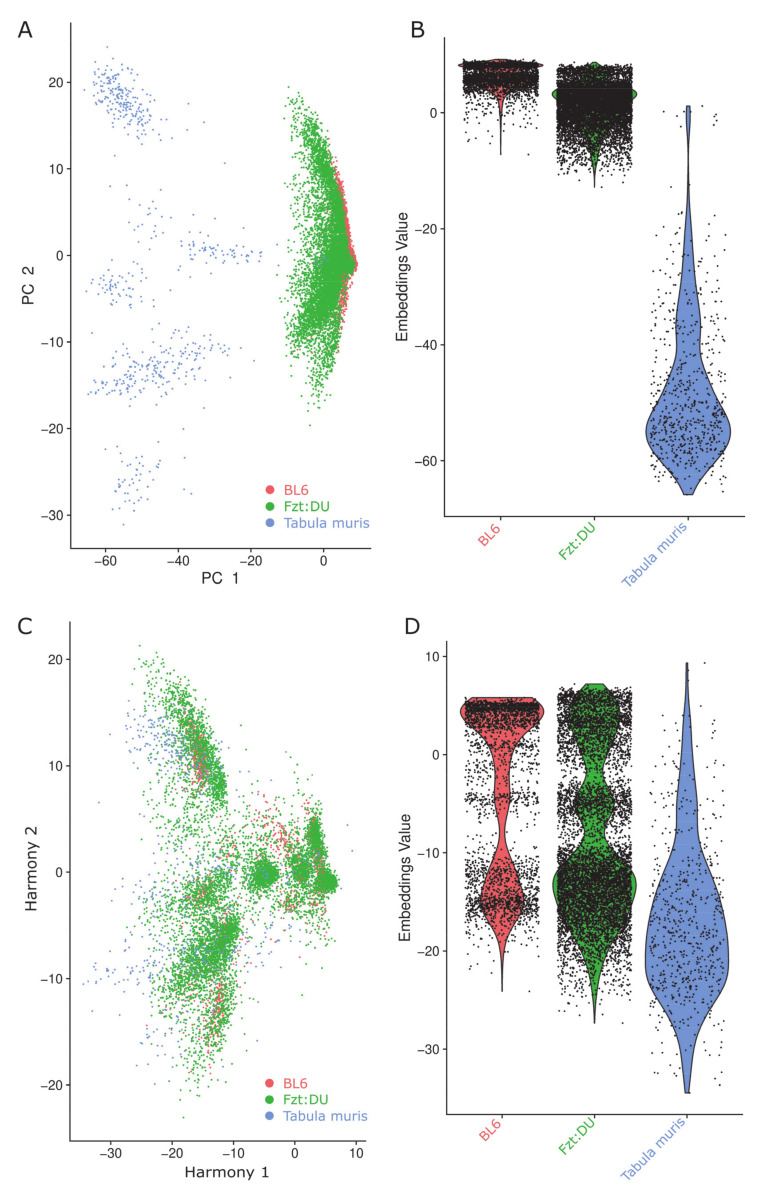
Figure 1.
Clustering effects of the data integration with and without utilizing Harmony on the embedding in the first two principal components (PC) on the indicated datasets (BL6, red; Fzt:DU, green; Tabula muris, blue). (A) PCA-plot of the three investigated datasets without Harmony processing. (B) Violin plot of the investigated datasets without Harmony processing. (C) PCA-plot of the three investigated datasets with Harmony processing. (D) Violin plot of the three investigated datasets with Harmony processing.

