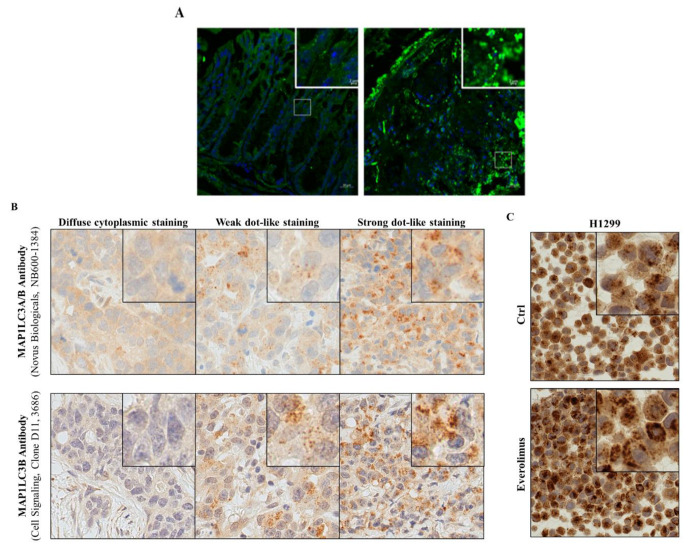
Figure 4.
Immunofluorescence for MAP1LC3B. (A) Colon tissue sections of a control mouse and a mouse treated by TNBS to induce acute colitis. Staining for DNA with DAPI (blue) and for MAP1LC3 with Alexa-fluor labeled specific antibodies; (B) MAP1LC3A/B immunohistochemistry staining of three archived FFPE samples from patients with an adenocarcinoma of the lung. Different MAP1LC3A/B expression levels were visualized using two different antibodies, as indicated. (C) MAP1LC3A/B immunohistochemistry staining of FFPE-H1299 NSCLC cells that were either left untreated (Ctrl) or treated with everolimus, a selective inhibitor of MTOR activity used to stimulate autophagy. Detailed instructions on how the quantification of LC3B dot formation is done can be found in [84,86,87]. See abbreviations in the abbreviations section.

