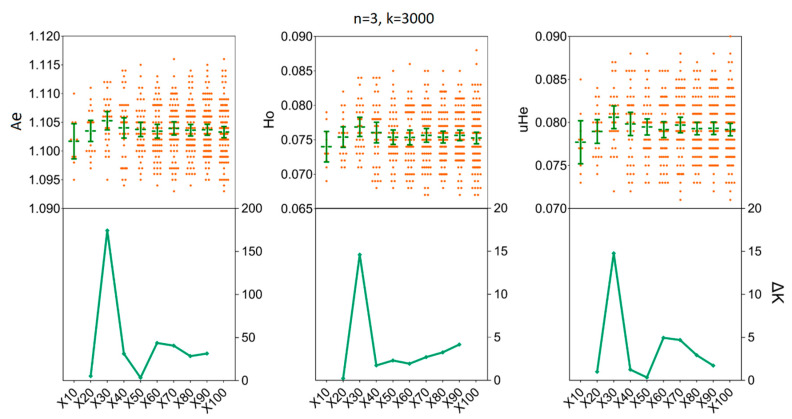
Figure 3.
The minimum number of resampling replicates (x) required to estimate the genetic diversity in LNSY population. Bars represent sample means and 95% confidence intervals of the means. The ΔK (Y-axis) shows a clear peak at the optimal replicates (x). Ae, number of effective alleles; Ho, observed heterozygosity; uHe, unbiased expected heterozygosity.

