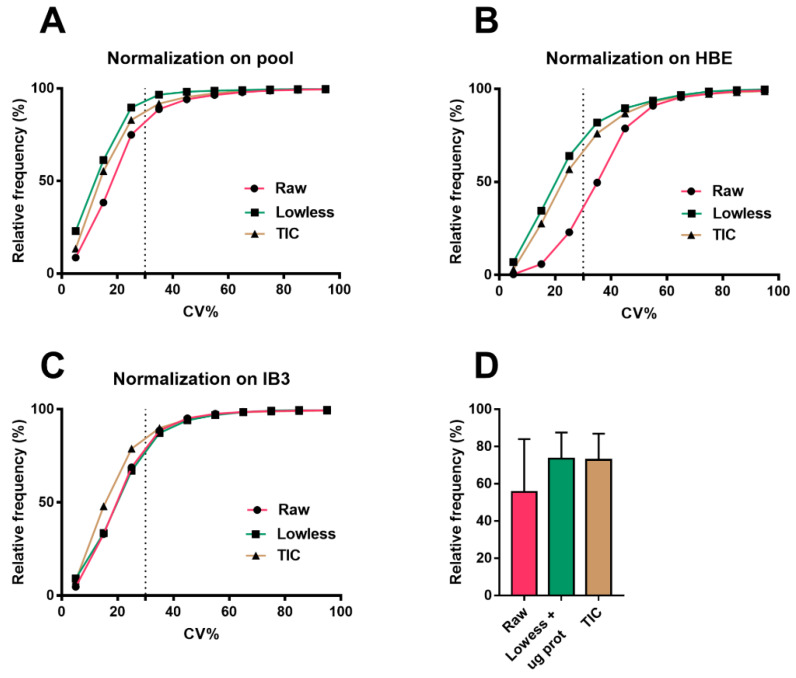
Figure 1.
Cumulative frequency distribution of the coefficient of variations (CVs) (%) in (A) pool samples, (B) healthy HBE, and (C) cystic fibrosis (CF) cell extracts obtained for the precision evaluation of different normalization protocols comprehensive of results from both polarities. The dotted line indicates the separation between features within 30% of the CV, which is intended as the maximum permitted for the validation. The graphs showed the better performance of Lowess coupled to µg proteins as the normalization technique, reaching (A) 89%, (B) 64%, and (C) 68% in acceptable features (with a CV% inferior to 30%). (D) Graphs show the mean ± SD of the percentage of acceptable features (with a CV% inferior to 30%) between the different normalization techniques.

