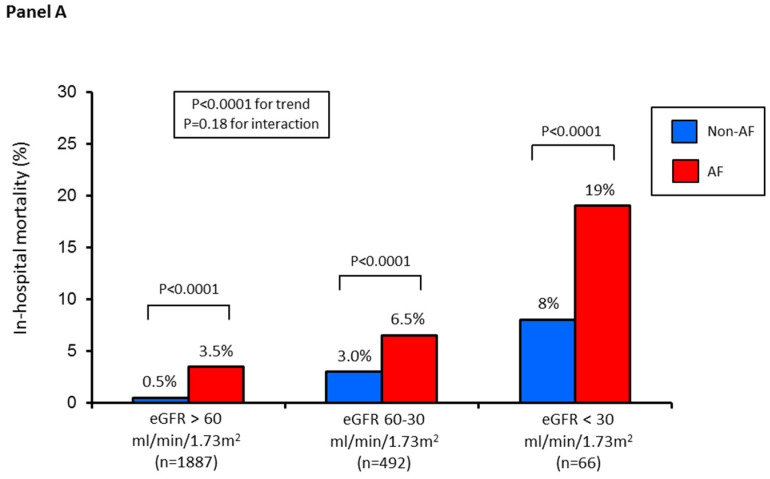
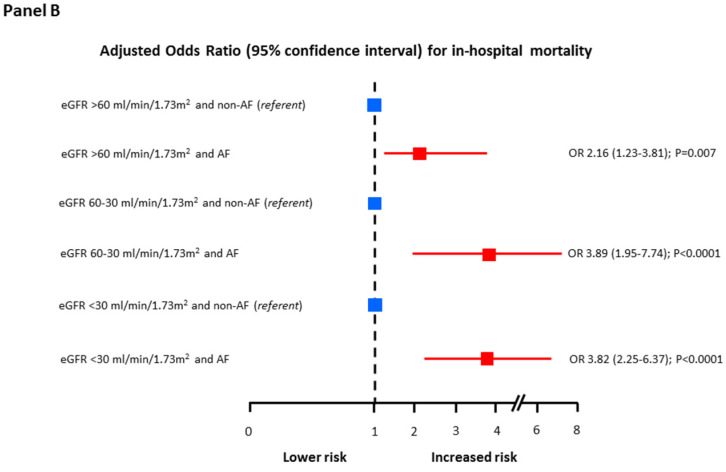
Figure 3.
(Panel A) In-hospital mortality rate in the three study groups according to AF (yes vs. no). (Panel B) Adjusted odds ratio (OR) and 95% confidence intervals for in-hospital mortality according to AF in each study group. Odds ratios were adjusted for independent predictors of in-hospital mortality, identified by logistic regression analysis with stepwise selection of variables (age, acute myocardial infarction type, left ventricular ejection fraction, Killip class, and admission glycemia) in the entire study population.


