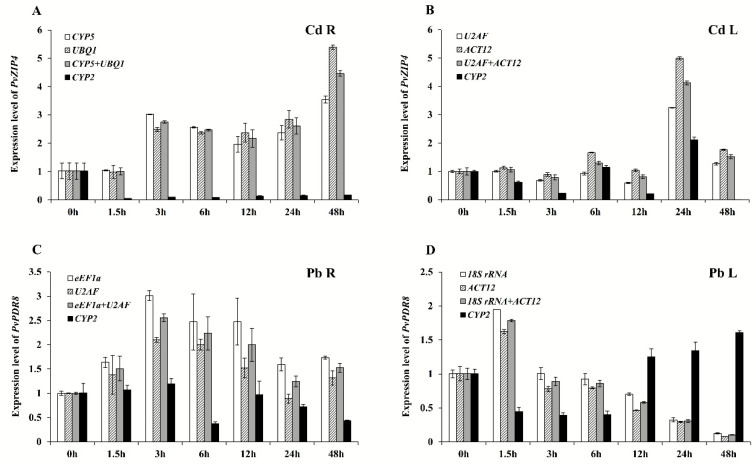
Figure 4.
Expression levels of PvZIP4 and PvPDR8 in switchgrass leaves and roots under Cd and Pb stresses at different times. (A,B) represent expression levels of PvZIP4. (C,D) represent expression levels of PvPDR8. The relative expression levels were fold-change to time 0 h. R, L represent roots and leaves, respectively. Bars indicate standard errors.

