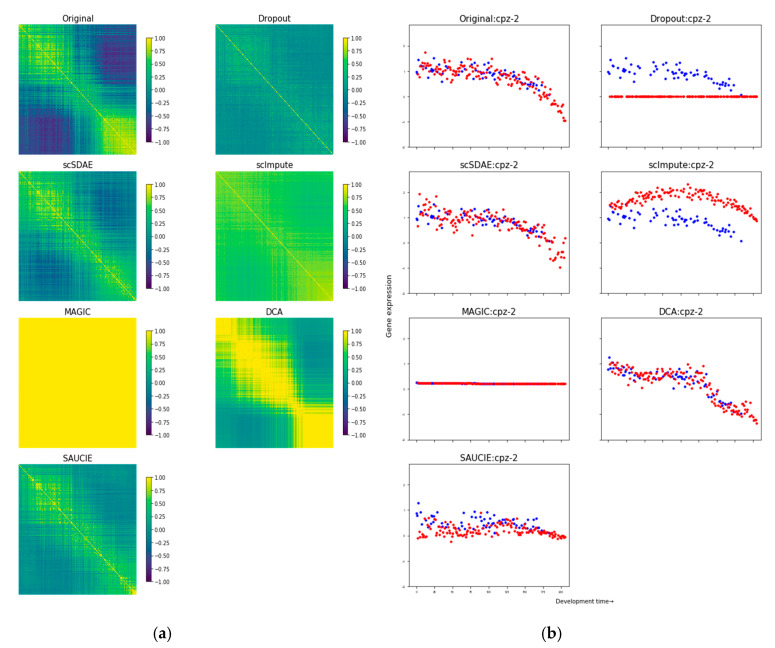
Figure 2.
Performance comparison of simulated data. (a) The heatmaps of sample-to-sample correlation matrices show scSDAE best recovered sample developmental trajectory affected by simulated missing values. The samples are ordered by developmental time. So as is shown in the original data and scSDAE, the correlations around diagonal should be high, but correlations off the diagonal should not. (b) Scatter plots of gene expression trajectory show that scSDAE best recovered gene expression affected by simulated missing values for gene cpz-2. Scatter plots of the expression trajectory of randomly selected gene cpz-2 from the original bulk data, simulated missing data, and expression data imputed after different imputation methods are shown. The horizontal axis represents the development time of the samples. The vertical axis stands for the gene expression value. Each point represents a sample. The red points represent the values simulated to be zeros, and the blue ones represent the observed values.

