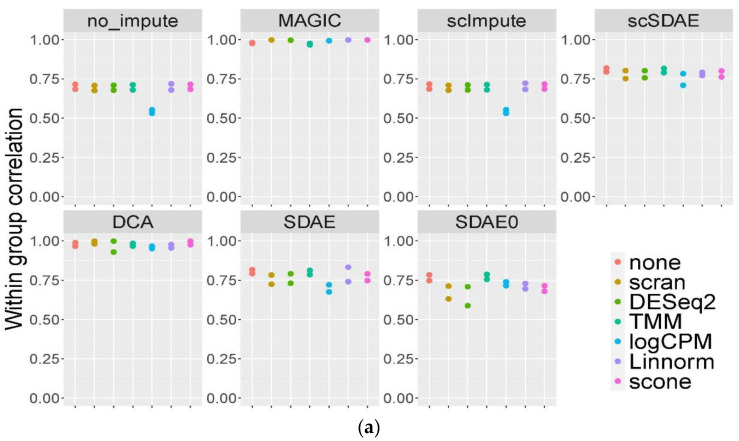
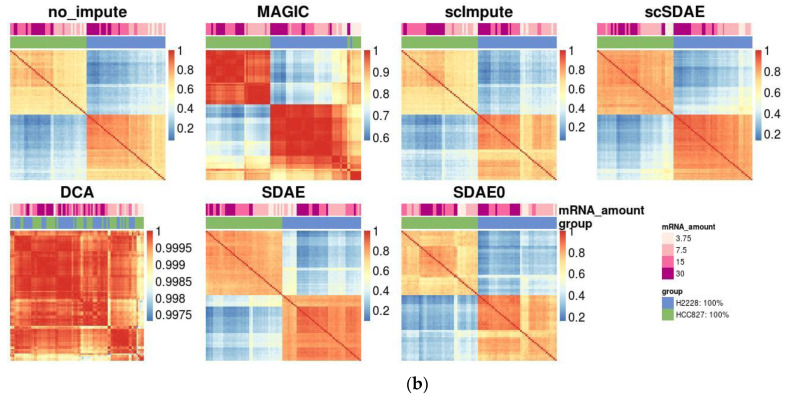
Figure 3.
Comparisons of imputation methods using RNA mixture dataset. (a) Average Pearson correlation coefficients for cells within the same groups in the CEL-seq2 and Sort-seq datasets (n = 2) from different combinations of normalization and imputation methods. (b) Heatmaps of Pearson correlation coefficients for samples in the CEL-seq2 dataset that contained pure H2228 (n = 45) or HCC827 (n = 44) RNA obtained from different imputation methods after TMM normalization.


