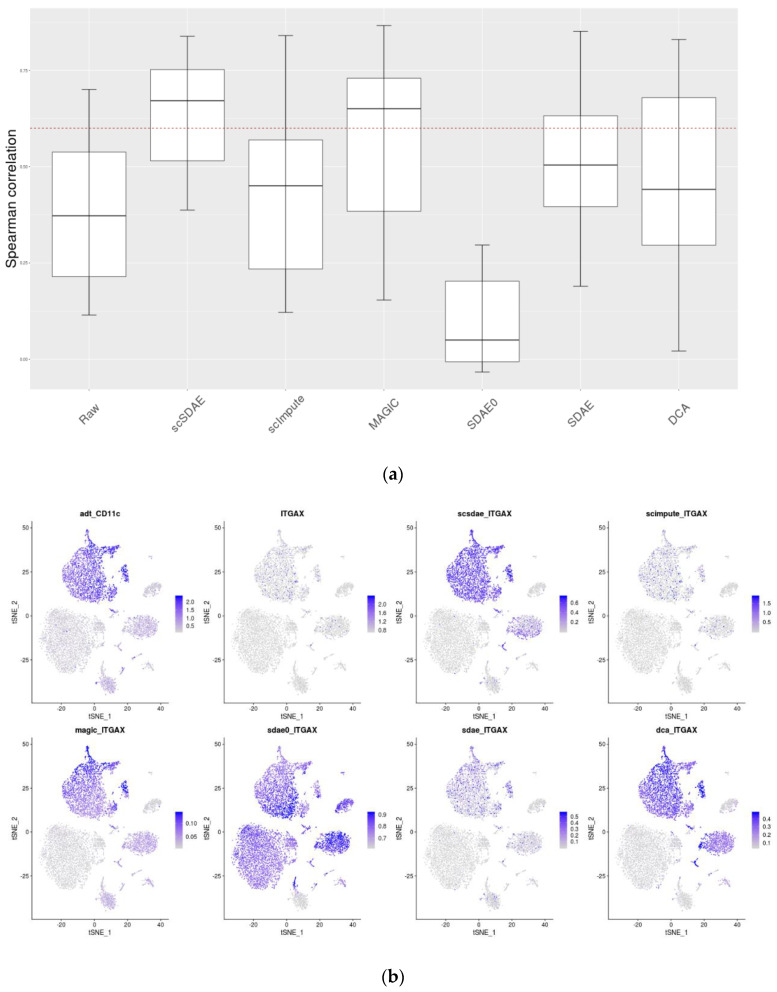
Figure 5.
Consistency of RNA and protein levels in CITE-seq data. (a) Boxplot of the Spearman correlations of the protein-RNA pairs in CITE-seq data (The red dashed line represents y = 0.6). (b) Featureplot of the cells in CITE-seq data. TSNE visualizations of the cells are shown in the figure where each point represents a cell, and the colors of points indicate the expression levels of the protein and corresponding RNA of gene CD11c (ITGAX).

