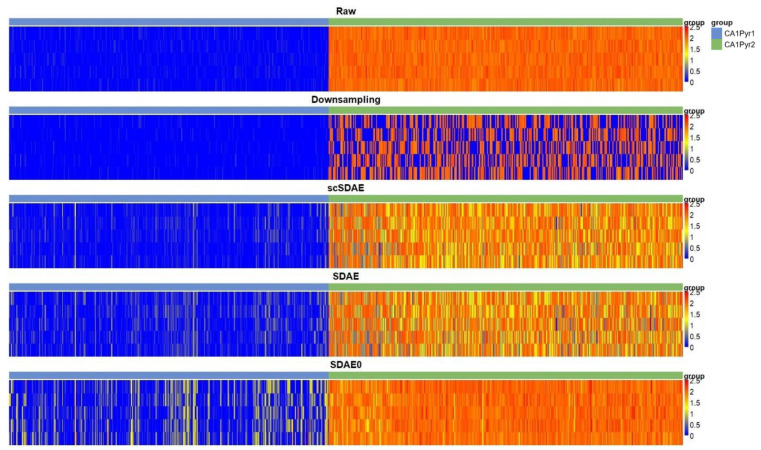
Figure 6.
The heatmaps of five artificial genes with 50% zeros in the CA1Pyr1 and CA1Pyr2 groups are shown. The vertical axis represents the artificial genes, and the horizontal axis stands for the cells. True values in the CA1Pyr1 group are close to zero, while true values in the CA1Pyr2 group are high. scSDAE imputed least false positive values in the CA1Pyr1 group.

