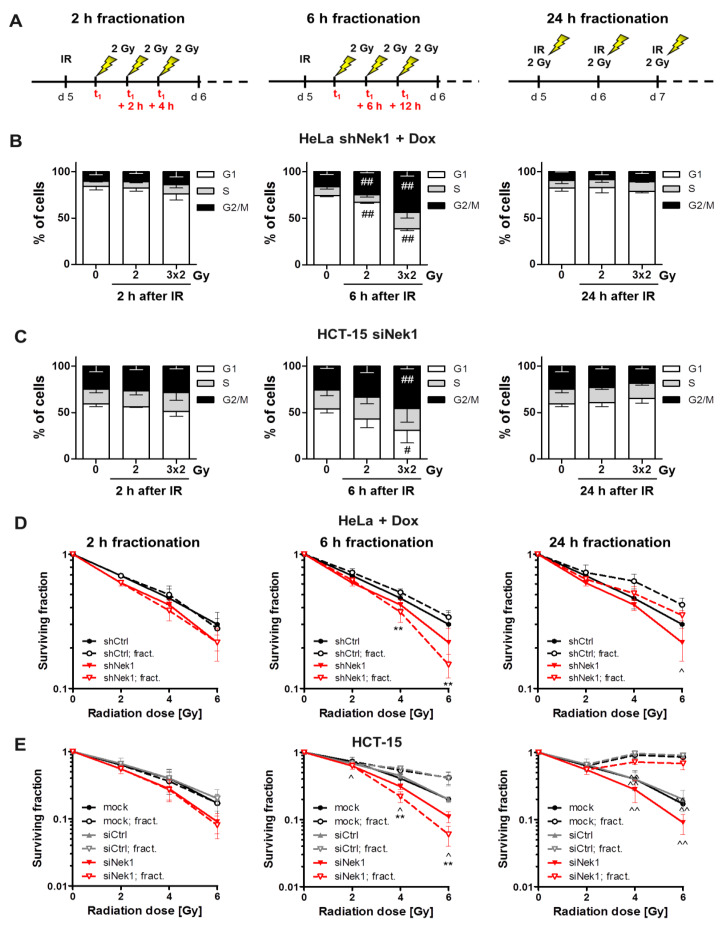
Figure 2.
(A) Schematic representation of the different fractionation schedules. Cell cycle distribution of Nek1 KD HeLa (B) and HCT-15 cells (C) at 2 h. 6 h and 24 h after irradiation with either a single dose of 2 Gy, or fractionated 3 × 2 Gy with an interval of 2 h (left), 6 h (middle) and 24 h (right) analyzed by flow cytometry (n = 3; # p < 0.05, ## p < 0.01 irradiated vs. non-irradiated cells). 3D clonogenic radiation survival following a 2, 4 or 6 Gy single dose irradiation or fractionated irradiation with 2 h (left), 6 h (middle) and 24 h interval (right) of Nek1 KD HeLa (D) and HCT-15 cells (E). Stable shCtrl expressing HeLa cells and mock (m) or control siRNA-treated HCT-15 cells, treated in a similar manner, served as a control (for all graphs means ± SD; n = 3; * p < 0.05, ** p < 0.01 Nek1 KD vs. control, ^ p < 0.05, ^^ p < 0.01 fractionated vs. single dose).

