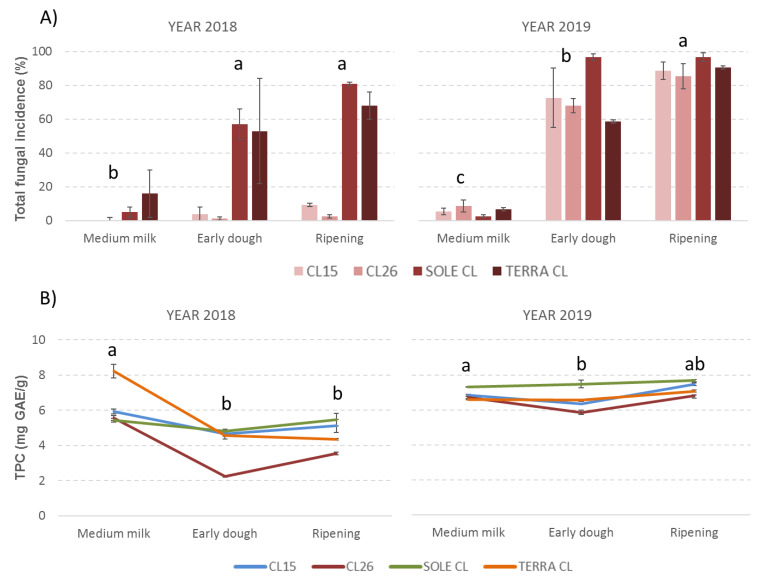
Figure 3.
Mean incidence of total fungi infection (% of grains infected with fungi) (A) and mean total phenolic content (TPC) (B) found in the 4 rice varieties considered in the study at 3 different sampling times during the plant growing season observed in years 2018 and 2019. The error bars represent the standard deviations of the 3 replicates. Values with different letters differ significantly (p ≤ 0.05).

