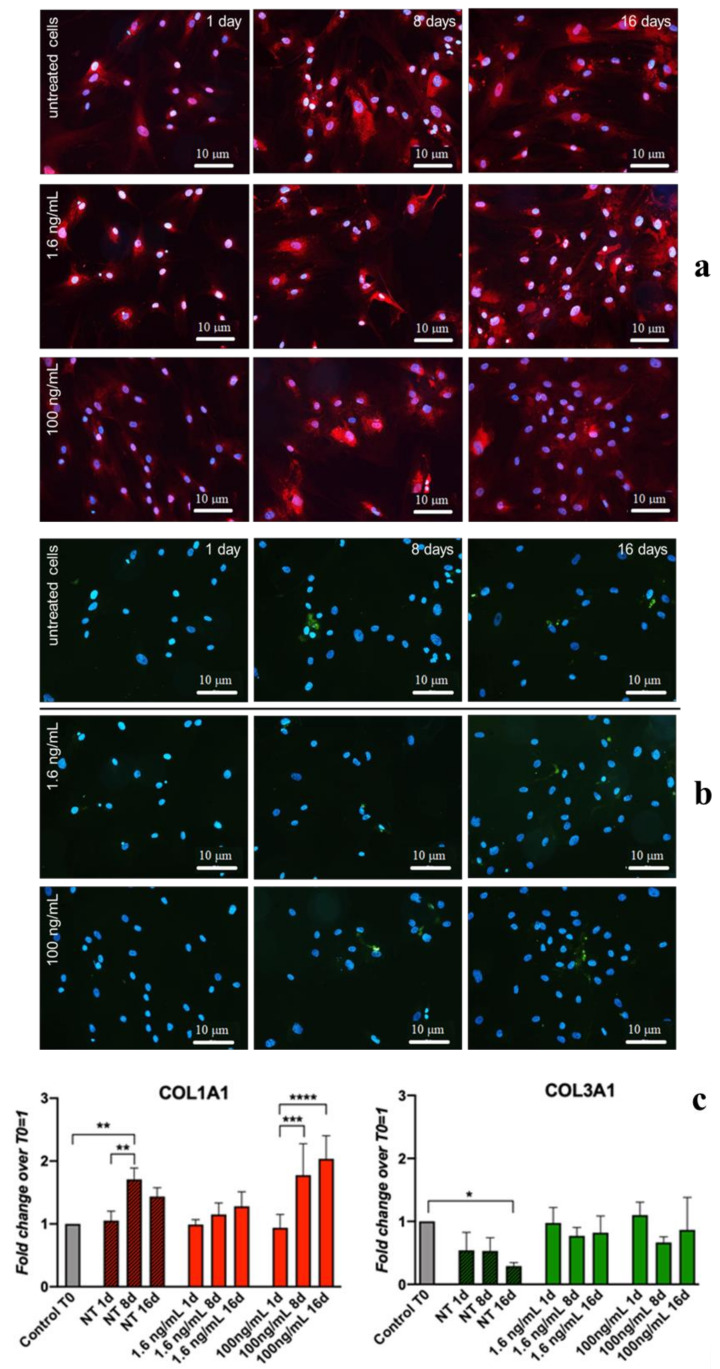
Figure 2.
IF and quantitative-IF assays of type 1 Collagen (COL1A1) and type 3 Collagen (COL3A1) monitored along hBM-MSCs treatment with 1.6 ng/ and 100 ng/mL of ihGDF-5 for 16 days. Type 1 collagen was stained in red; type 3 collagen was stained in green; cell nuclei highlighted with DAPI in blue (a,b). Quantitative signal detection was performed via ImageJ software (c). A slight up-regulation of COL1A1 was observed when hBM-MSC were in routine culture for 16 days. Color intensity in each time point was normalized by the cell number. * ≤0.05; * *<0.01; *** <0.005; **** <0.001. n = 10 (image fields for each time point).

