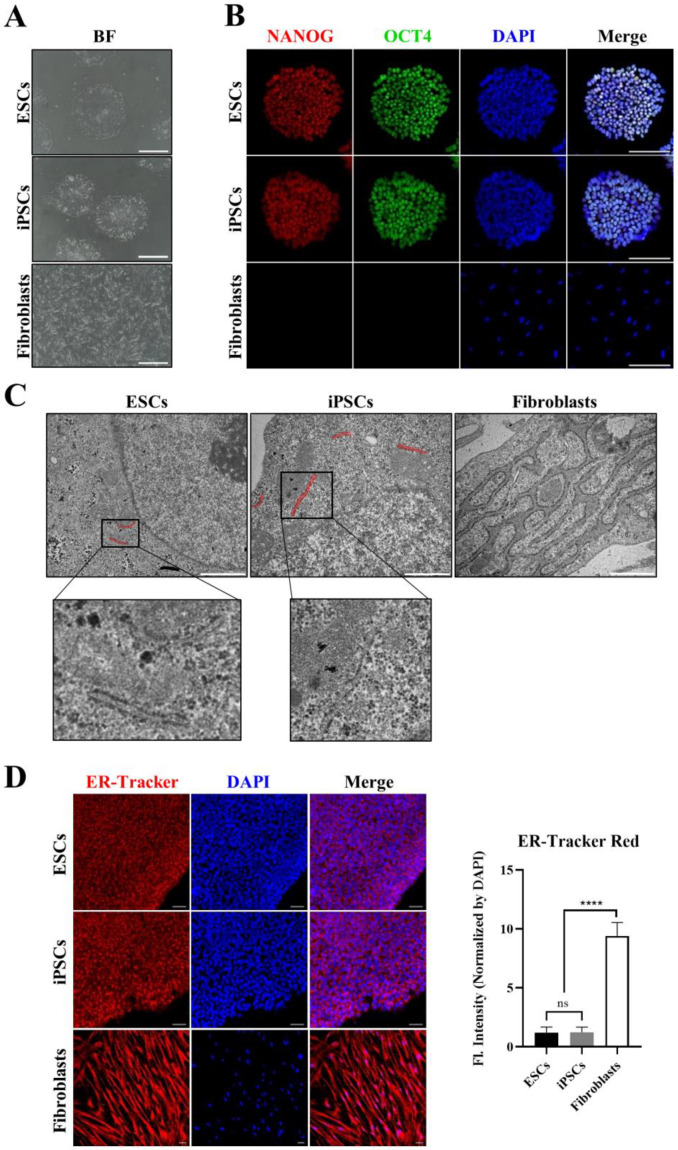
Figure 1.
Morphological differences of the endoplasmic reticulum (ER) in human pluripotent stem cells (hPSCs) and fibroblasts. (A) Bright field (BF) image showing cultured cells before harvesting for transmission electron microscopy (TEM) analysis. Scale bar: 200 μm (B) Immunostaining showing the expression of NANOG (red fluorescence) and octamer-binding transcription factor 4 (OCT4 as known POU5F1) (green fluorescence) in hPSCs. Scale bar: 150 μm (C) TEM images showing the ER structure of each sample. Red bar indicates the ER in hPSCs. The small images show enlarged ER. Scale bar: 1 μm. (D) Confocal microscopy images showing the ER tracker signal that binds to ER. Fluorescence intensity graph indicate that 4′,6-diamidino-2-phenylindole (DAPI) normalized ER tracker signal. Scale bar: 50 μm. Values represent the mean ± SD. Tukey’s t test: **** p < 0.00001; “ns” represents non-significant differences.

