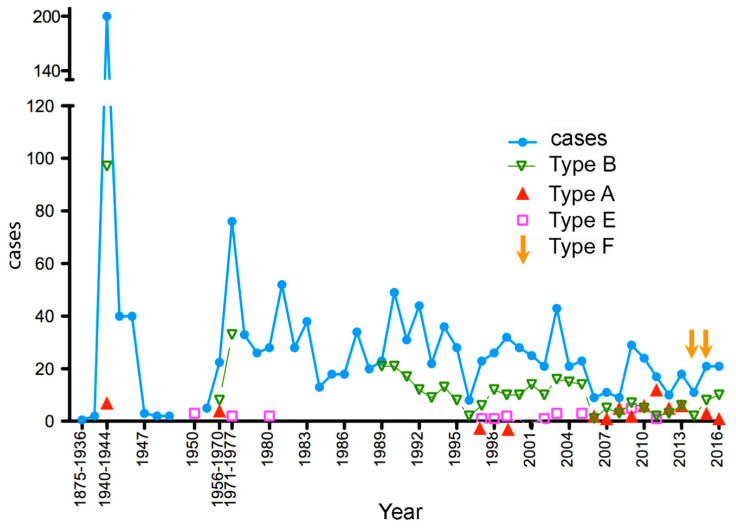
Figure 1.
Incidence of human botulism in France, 1875–2016. The numbers indicated in the period ranges 1875–1936, 1940–1944, 1956–1970, and 1971–1977 are the annual mean values. Total cases (blue), type B botulism (green), type A botulism (red), type E botulism (purple), type F botulism (orange arrows) according to [17,19,24,25,26,27,28,29,30,31,32,33,34,35] and modified from [11].

