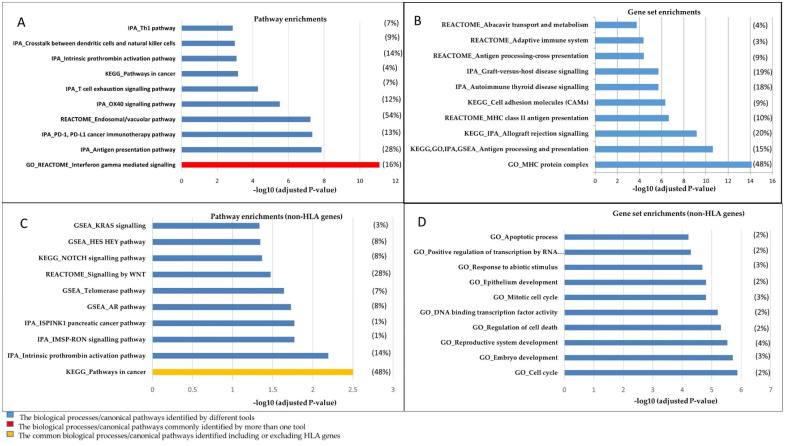
Figure 2.
The top 10 significant canonical pathways and gene sets resulting from algorithms used in this study. The diagrams illustrate (A) enrichments in pathways and (B) gene sets in biological processes, including HLA genes. (C,D) represent the analyses conducted while excluding HLA genes. The significant pathways/gene sets have been depicted in the graphs based on –log10 (p-value). A full list of the pathways and gene networks has been represented in Tables S2 and S3. The algorithm that has been used for each pathway/gene set is shown as a prefix. The ratios of post-GWAS/total genes involved in a pathway/gene set are presented in parentheses for a given pathway/gene set. The average of this ratio is presented for a pathway/gene set resulted from more than one tool. Note: To avoid over-presentation of the GO results, we depicted all immune system-related gene sets resulting from GO as antigen processing and the presentation gene set.

