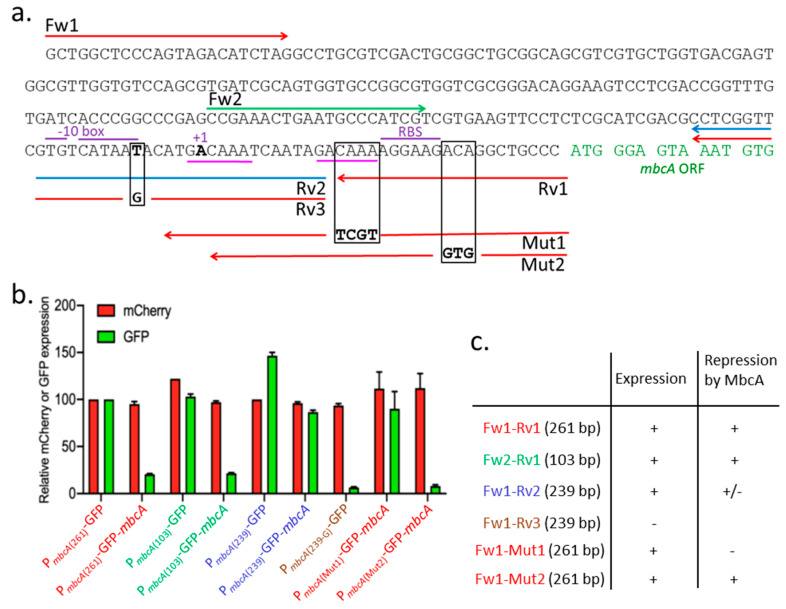
Figure 4.
Genetic analysis of the promoter/operator region of the mbcAT operon. (a) DNA sequence of the mbcA promoter/operator region. Arrows indicate oligonucleotides used to amplify various fragments encompassing the promoter region. Black squares surround the nucleotides modified by mutations introduced in the oligonucleotides Rv3 (T=>G), Mut1 (CAAA=>TCGT), and Mut2 (ACA=>GTG). +1 points to the transcription start site. (b) Mean fluorescence intensities (MFI) were determined by flow cytometry with strains harboring the different constructs. Red and green bars indicate MFI relative to that of strain harboring pGMCS-mCherry-PMbcA-GFP. Values are the average of two biological replicates with standard deviation. (c) Summary of the results obtained with the different constructs.

