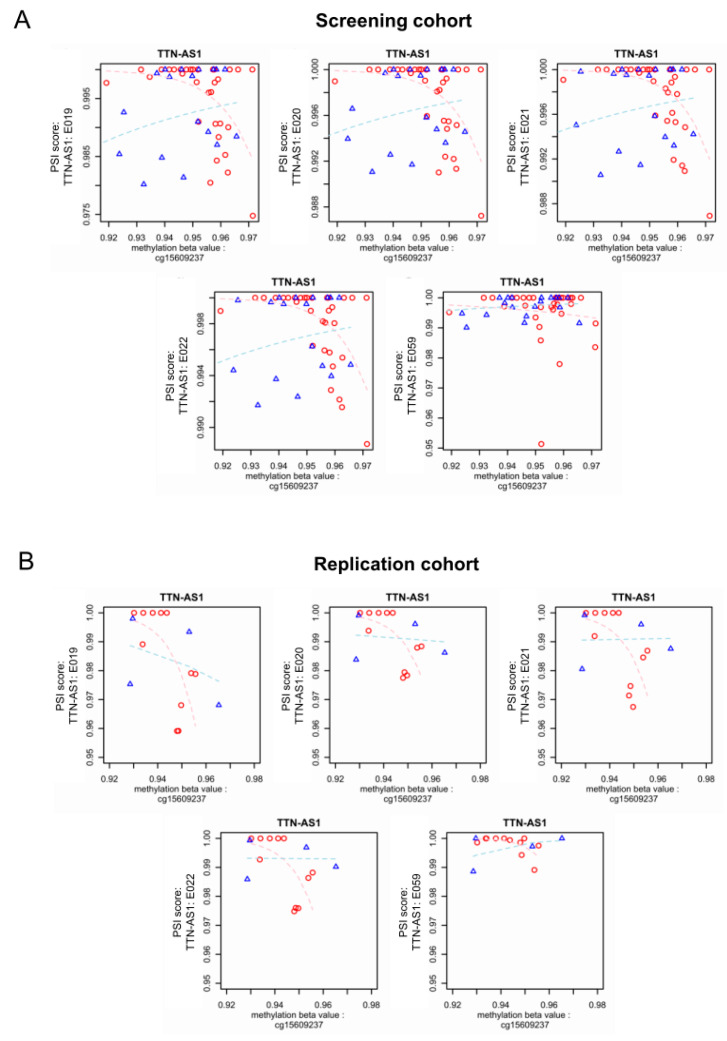
Figure 7.
Visualization of DNA methylation measurements and PSI scores of validated genomic regions in TTN-AS1. For each validated candidate, all study subjects of the screening cohort were plotted by their methylation measurements (X-axis) and PSI scores (Y-axis). The conditions of the samples are color-coded (red: DCM, blue: Control). The depicted regression lines were computed using logistic regression and are also color coded (pink: DCM, light blue: Control). The same visualization for the replication cohort is presented below, showing the conserved principle. (A) Screening cohort; (B) Replication cohort.

