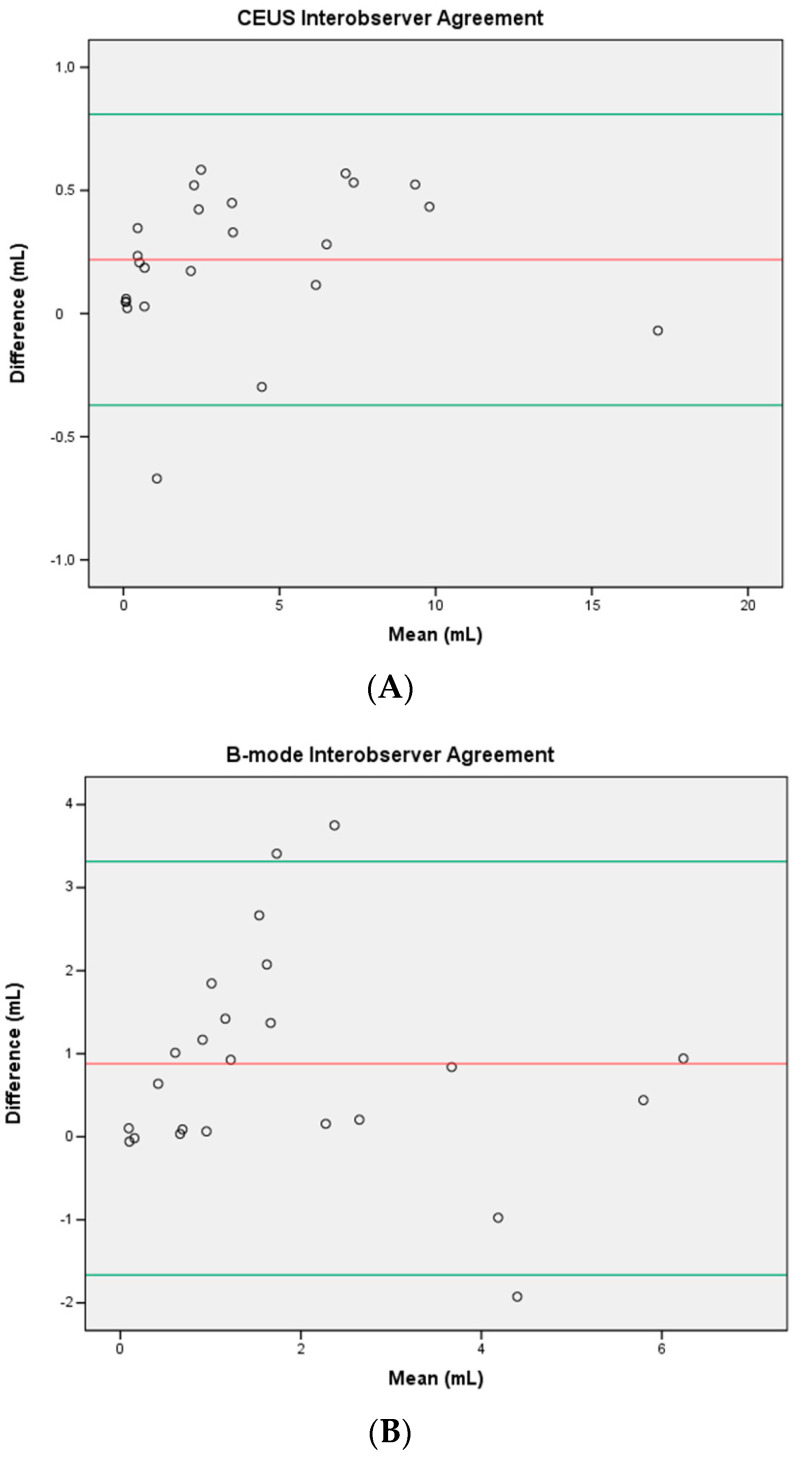
Figure 1.
Bland–Altman plots showing inter-observer reproducibility of measurements for CEUS (A) and B-mode (B) assessments. The x-axes show the mean of the volume measurements, and the y-axes show the differences between the measurements. Red lines = mean difference between readers, and green lines = 95% (1.96 SD) limits of agreement.

